
- Title
-
Anterior lateral plate mesoderm gives rise to multiple tissues and requires tbx5a function in left-right asymmetry, migration dynamics, and cell specification of late-addition cardiac cells
- Authors
- Mao, L.M.F., Boyle Anderson, E.A.T., Ho, R.K.
- Source
- Full text @ Dev. Biol.
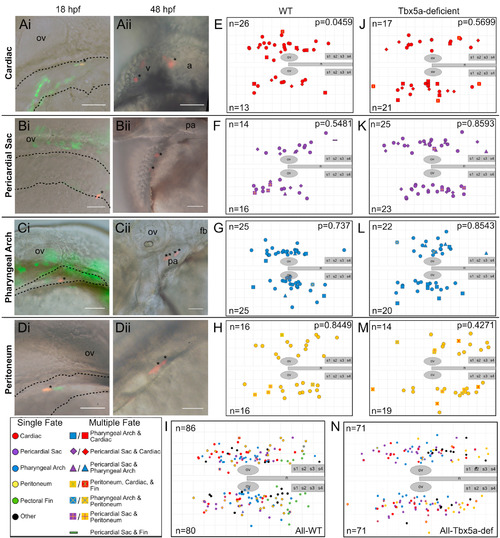
Single-cell resolution 18 hpf fate map of WT and Tbx5a-deficient aLPM. A-D Examples of labeled wild-type single cells within the aLPM, dashed outline. Asterisk marks a single cell photoconverted to express red fluorescent Kaede, whose starting position was measured as the anteroposterior and mediolateral distance from the otic vesicle. Anterior to the left, dorsal to the top; some images taken on the right side of the embryo have been flipped. Ai- Dorso-lateral view of the 18 hpf embryo. Aii- Ventral view of the same embryo at 48 hpf. Asterisks mark resultant clone in the heart. Bi, Bii- Dorso-lateral view of pericardial sac clone. Ci, Cii- Pharyngeal arch clone. Di, Dii- Peritoneum clone. E-N Combined dorsal-lateral view fate map of aLPM cell fates at 18 hpf from both left and right sides (E-I wild-type, J-N Tbx5a-deficient), showing the four fate categories: E, J-cardiac; F, K-pericardial sac; G, L-pharyngeal arch; and H, M-peritoneum. I, N- Summary fate map of all labeled single cells. Circles denote unipotent clones, other shapes denote multipotent clones, refer to legends for identity. n counts represent the number of precursors from the right or left aLPM that gave rise to that particular fate. p-values determined by comparing the number of left and right precursors using the Fisher’s Exact test. v, ventricle; a, atrium; fb, fin bud; ov, otic vesicle; pa, pharyngeal arches; n, notochord; s1, somite 1. Grid length and scale bar: 100 μm. |
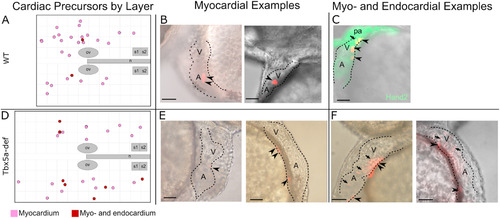
Cardiac precursors within the lateral aLPM give rise to myocardial and infrequent endocardial cells. A- Twenty-seven (27) photoconverted wildtype clones gave rise to only myocardium (pink), while two (2) gave rise to myocardium and endocardium (burgundy). B, C, E, F- Examples of larval hearts at 48 hpf, outlined with dashed lines, lateral view. B- WT cardiac precursors that gave rise only to myocardium cells, which display a cuboidal morphology (arrowheads). C- WT cardiac precursor that gave rise to myocardium and as well as endocardium cells, which in general are smaller and more elongated in morphology than myocardial cells (arrow). Hand2 expression marks the larval heart and pharyngeal arches at 48 hpf. D- Nineteen (19) photoconverted Tbx5a-deficient clones gave rise to only myocardium (E arrowheads), while seven (7) gave rise to myocardium and endocardium (F arrows). ov-otic vesicle; n-notochord; s1-somite 1; A-atrium; V- Ventricle, pa-pharyngeal arch. Scale bar 100 μm. |
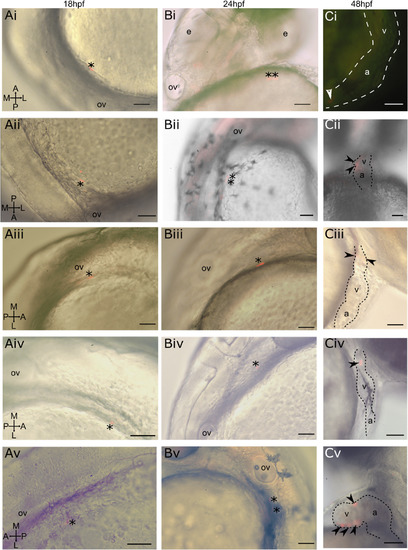
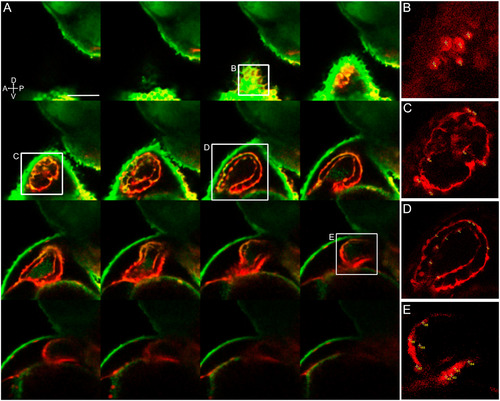
Photoconverted lateral aLPM cardiac precursor clones do not contribute to the primary heart tube at 24 hpf. i-v Displaying five of 39 examples of wildtype embryos. A- Dorso-lateral view of 18 hpf embryo. Asterisk marks a single cell photoconverted to express red fluorescent Kaede. B- Lateral view of same embryo at 24 hpf. Asterisk marks photoconverted cardiac precursor still within the lateral ALPM and outside of the primary heart tube, currently out of view on the left side of the embryo. C- Lateral view of same embryo at 48 hpf. Arrowheads mark photoconverted cardiac precursors within the larval heart. Ci- Located in in-flow tract; Cii-located in ventricle and atrioventrical canal; Ciii-located in outflow tract; Civ-located in outflow tract; Cv-located in ventricle. a-atrium; v-ventricle; ov-otic vesicle, e−eye. Scale bar 100 μm. |
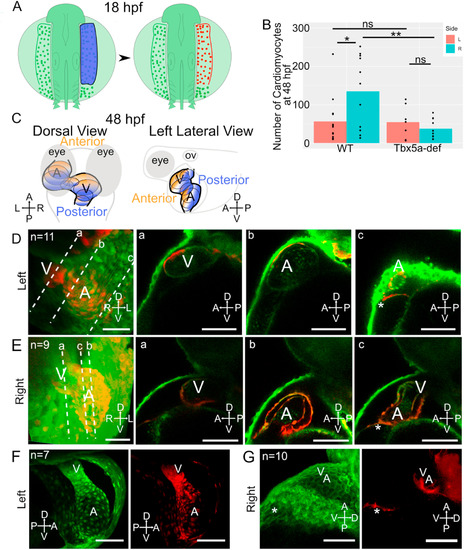
Asymmetric aLPM contributions to the larval heart are affected by Tbx5a knockdown. A- Schematic of experimental method with right side lateral aLPM photoconverted using 405 nm light (shown as blue) at 18 hpf. B- Bar plots of mean number of KaedePC cardiomyocytes at 48 hpf in each experimental condition. Points are counts from each embryo (Fig. S5). Statistics performed using the Wilcoxon Rank Sum test. C- Schematic at 48 hpf showing anterior (orange) versus posterior (blue) regions of the heart in dorsal and left lateral views. D-G- 48 hpf 3D projection of a confocal stack of the larval heart shows the contributions of red fluorescent KaedePC cells among green fluorescent Kaedenon−PC cells, D-E-WT embryos, anterior view. Dotted lines a-c are levels of individual Z-slices through the a-ventricle, b-atrium, and c-connecting region between the venous pole and pericardial sac. D- Heart derived from left side aLPM. E− Heart derived from right side aLPM. F-G- Tbx5a-deficient embryos, F- Heart derived from left side aLPM, anterior view. G- Heart derived from the right side aLPM, left lateral view. A-atrium; V-ventricle; asterisk-venous pole of the heart. Compass abbreviations: A-anterior; P-posterior; D-dorsal; V-ventral; R-right; L-left. Scale bar: 100 μm. |
Photoconverted cardiomyocytes counted manually from a z-stack of the larval heart. A- 48 hpf left lateral side 3D stack of the heart, displaying every fourth stack of 2.0 μm. Red fluorescence shows right side lateral aLPM-derived Kaede-expressing cells photoconverted at 18 hpf. B-E Insets of the heart showing examples of how cardiomyocytes were counted with numbered points in yellow. This embryo had a total of 185 red fluorescent cardiomyocytes counted, which was verified by the average of three separate manually counted analyses. |
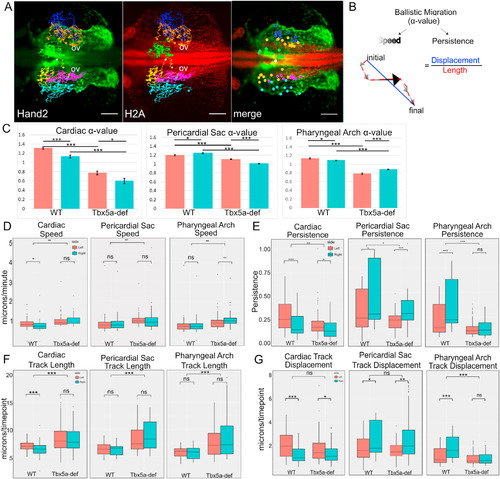
Migration dynamics of WT cardiac precursors versus Tbx5a-deficient embryos. A- Cell tracks of Hand2-expressing aLPM, colored by their fate at 34 hpf and laterality side of origin (White-reference point for drift correction; Green-cardiac precursors from the right; Yellow-cardiac precursors from the left; Orange-pericardial sac precursors from the right; Magenta-pericardial sac precursors from the left; Blue-pharyngeal arch precursors from the right; Cyan-pharyngeal arch precursors from the left). Background maximum-intensity projection image 20x magnification of Hand2-eGFP; H2A-mCherry embryo at 18 hpf, when time-lapse begins (Supplemental Movie 3). Merge projection is overlaid with initial positions of backtracked cells. Dorsal view, anterior to left. Scale bar- 100 μm. B- The degree of ballistic migration can be measured by α-value and is a factor of the speed and persistence of migration. Speed is denoted by the magnitude of individual displacement arrows and the greyscale gradient level. Persistence is the ratio of net displacement (final minus initial position, blue) and total length (distance traveled, red). C-G- Migration dynamics of cell tracks by organ precursor, comparing WT to Tbx5a MO and progenitors from the left versus the right: C- α-values, and the derivation can be seen in Fig. 9. Statistics performed using a comparison of slopes test; D- Average speed; E− Persistence F-Total track length, normalized by the number of timepoints tracked; G- Net track displacement, normalized by the number of timepoints tracked. Statistics performed using the Kruskal-Wallis rank sum test. 10 cells tracked per group per embryo. n = 6 embryos. |
Reprinted from Developmental Biology, 472, Mao, L.M.F., Boyle Anderson, E.A.T., Ho, R.K., Anterior lateral plate mesoderm gives rise to multiple tissues and requires tbx5a function in left-right asymmetry, migration dynamics, and cell specification of late-addition cardiac cells, 52-66, Copyright (2021) with permission from Elsevier. Full text @ Dev. Biol.