
- Title
-
The Downregulation of c19orf12 Negatively Affects Neuronal and Musculature Development in Zebrafish Embryos
- Authors
- Mignani, L., Zizioli, D., Borsani, G., Monti, E., Finazzi, D.
- Source
- Full text @ Front Cell Dev Biol

ZFIN is incorporating published figure images and captions as part of an ongoing project. Figures from some publications have not yet been curated, or are not available for display because of copyright restrictions. |
|
ZFIN is incorporating published figure images and captions as part of an ongoing project. Figures from some publications have not yet been curated, or are not available for display because of copyright restrictions. EXPRESSION / LABELING:
|
|
ZFIN is incorporating published figure images and captions as part of an ongoing project. Figures from some publications have not yet been curated, or are not available for display because of copyright restrictions. EXPRESSION / LABELING:
|
|
ZFIN is incorporating published figure images and captions as part of an ongoing project. Figures from some publications have not yet been curated, or are not available for display because of copyright restrictions. PHENOTYPE:
|
|
ZFIN is incorporating published figure images and captions as part of an ongoing project. Figures from some publications have not yet been curated, or are not available for display because of copyright restrictions. PHENOTYPE:
|
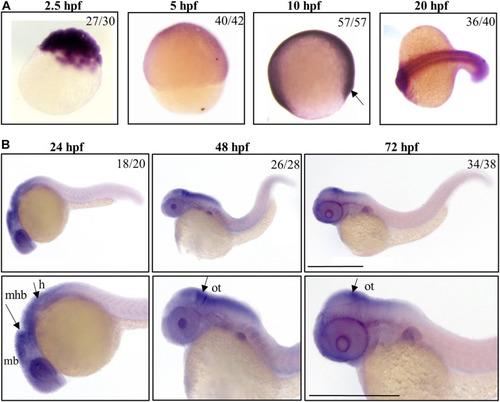
Spatio-temporal analysis of gene EXPRESSION / LABELING:
|

Morphological analysis of embryos micro-injected with an ATG-blocking morpholino. Embryos were injected with the gene |
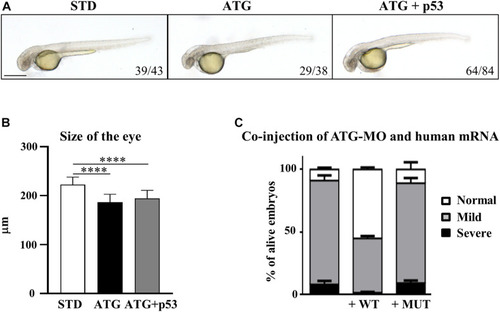
Assessment of the specificity of the phenotype. PHENOTYPE:
|

|
|
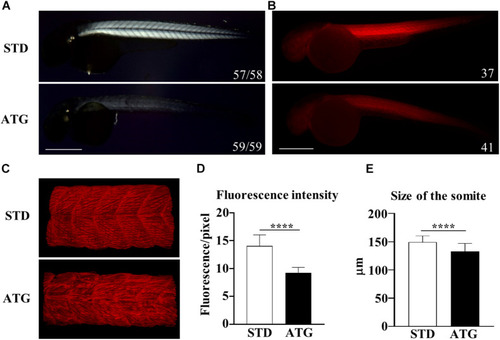
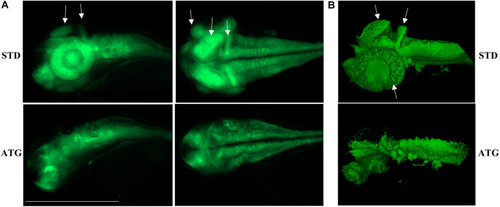
Birefringence analysis and F-actin staining. PHENOTYPE:
|
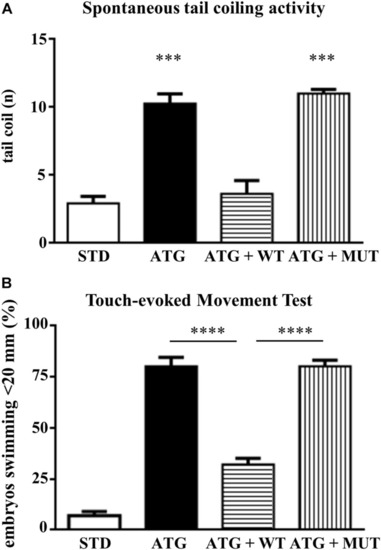
Analysis of locomotor behavior. PHENOTYPE:
|