FIGURE

FIGURE 6

ID
ZDB-FIG-210113-31
Publication
Mignani et al., 2020 - The Downregulation of c19orf12 Negatively Affects Neuronal and Musculature Development in Zebrafish Embryos
Other Figures
All Figure Page
Back to All Figure Page
FIGURE 6

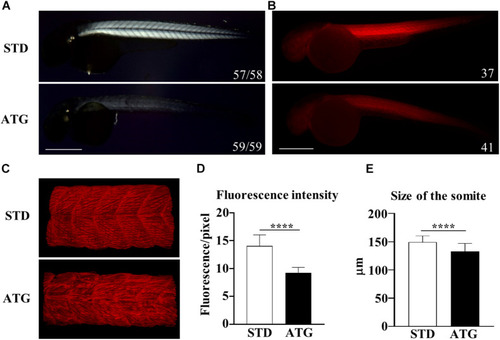
Birefringence analysis and F-actin staining. (A) Birefringence quantification in embryos injected with STD or ATG morpholino at 48 hpf. (B) Embryos were incubated with fluorescent phalloidin to stain F-actin. Representative lateral views of stained embryos showing the clear reduction of the total fluorescence intensity in ATG-morphants. Images were acquired with the same parameter, as described in section “Materials and Methods.” (C) Lightsheet imaging of a section of the trunk in the embryos as in (A). The image of the ATG-morphant was adjusted in order to show a fluorescence intensity comparable to that of the control embryo (STD). (D) Quantification of the fluorescence of embryos shown in (A), acquired by ZF-Mapper software. (E) Mean size of the trunk in control and ATG-morphants at 48 hpf, measured as described in section “Materials and Methods.” Three (birefringence) and two biological replicates (phalloidin staining) were performed. Numbers in each image indicate the total number of embryos analyzed. Size bar = 500 μm. ****P < 0.0001 (unpaired, two-tailed T-test).

Expression Data

Expression Detail
Antibody Labeling
Phenotype Data
Fish:
Knockdown Reagent:
Observed In:
Stage: Long-pec

Phenotype Detail
Acknowledgments
This image is the copyrighted work of the attributed author or publisher, and ZFIN has permission only to display this image to its users. Additional permissions should be obtained from the applicable author or publisher of the image. Full text @ Front Cell Dev Biol