
- Title
-
Pulsatile contractions promote apoptotic cell extrusion in epithelial tissues
- Authors
- Atieh, Y., Wyatt, T., Zaske, A.M., Eisenhoffer, G.T.
- Source
- Full text @ Curr. Biol.

Pulsatile contractions appear following cellular damage and predict extrusion events (A) Left: maximum intensity projection (MIP) of a larva tail 2 h post-MTZ treatment. Epithelial cells express NTR-mCherry (magenta) and LifeAct-GFP (green). Scale bar represents 50 μm. Magnified regions are represented by white square. Right: time-lapse sequence of pulsing epithelial cell until extrusion is shown. White arrowheads indicate pulsing events and red arrowheads extrusion event. Time is in hours and minutes HH:MM. See also Video S1. (B) Scatter dot graph correlating the area fold change of pulsing epithelial cells overtime. Dots represent the average area fold change ± SD of 155 pulses of 29 cells over 9 larvae. Average values of frequency (0.0046 s−1), duration (120 s), relative area loss (2.5%), and relative amplitude (15%) are represented. See also Figure S1E. (C) Scatter dot graph representing the cumulative number of pulses in all epithelial cells (purple line) and the cumulative number of extrusion events (blue line). T = 0 h is when live imaging starts. Analysis was performed in N = 5 larvae, and dots represent average values ± SEM. (D) Scatter dot graph representing single-cell examples of the area fluctuation of an extruding cell, neighboring cell, and non-extruding cell. See also Figure S1J. (E) Quantification of the duration, relative amplitude, relative area loss, and frequency (from left to right) of pulses in extruding, neighboring, and non-extruding cells. Analyses were performed on n = 20 cells/category over N = 5 larvae. (F) Quantification of the number of extruding cells in larvae treated with 10 mM of MTZ for 2 h, 10 mM of MTZ for 1 h, or 5 mM of MTZ for 2 h. Results are expressed as histograms ± SEM with all values. (G) Quantification of the duration, relative amplitude, and relative area loss (from left to right) of extruding cells in larvae treated with 10 mM of MTZ for 2 h (same larvae as in E), 10 mM of MTZ for 1 h, and 5 mM of MTZ for 2 h. Analyses were performed on n = 13–20 cells/category over N = 5 larvae. |

Pulsatile contractions are a cell-level behavior but induce area changes across neighbors (A) Left: time-lapse sequence of pulsing epithelial cells expressing LifeAct-GFP. Time is in minutes and seconds MM:SS. Scale bar represents 20 μm. Third panel represents flow fields where the length of the arrows is proportional to convergence/divergence. Lower panel represents convergence/divergence maps where convergence is blue and divergence is red. Color code gives the amplitude of convergence/divergence in s−1. Dashed red line represents the outline of tracked pulsing cell. Right: scatter dot graph correlating the area fold change (left axis; gray line as given by segmentation in Tissue Analyzer), divergence from a pulsing cell (right axis; red line), and neighboring cells (right axis; blue line). Dots represent average values of convergence/divergence of 182 pulses ± SEM in N = 3 larvae. (B) Time-lapse sequence of epithelial cells expressing LifeAct-GFP. Overlaid color map represents convergence/divergence field where blue is convergence and red is divergence. Red arrow indicates the first pulsing cell, and white arrow indicates neighboring cell that pulses afterward. Scale bar represents 20 μm. Time is in minutes and seconds MM:SS. See also Video S2 and Figures S2B and S2C. (C) Quantification of the duration, relative amplitude, and relative area loss of single-cell pulses versus multi-cell pulses. Analyses were performed on n = 10 cells/category over N = 3 larvae. (D) Left: time-lapse sequence of MIPs of larva tails where epithelial cells express NTR-mCherry (magenta) and LifeAct-GFP (green). Dotted white lines represent the contour of the tails. Time is in hours. Scale bar represents 100 μm. Right: scatter dot graph correlating the area fold change of DMSO-treated larvae and MTZ-treated larvae. Analysis was performed on N = 10 larvae/condition, and dots represent average values ± SEM. |
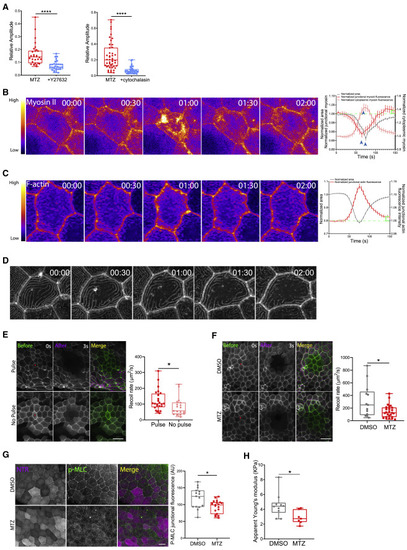
Tension at the tissue scale is reduced following damage but increases locally to produce pulsing (A) Quantification of the relative amplitude of pulses in larvae treated with MTZ versus MTZ+Y-27632 (left) or MTZ versus MTZ+cytochalasin (right). See also Video S3 and Figure S3A for analysis of the number of extruding cells. (B) (Left) Time-lapse sequence of a pulsing cell expressing myosin II-GFP. Purple and yellow colors represent low and high fluorescence intensities, respectively. Time is in minutes and seconds MM:SS. (Right) Scatter dot graph correlating the area fold change (left axis; gray line) and myosin fluorescence fluctuation (left axis; red and pink lines) of pulsing cells. Analysis was performed on n = 3 larvae, and dots represent average values of 79 pulses ± SEM. Blue arrowheads indicate the peak value of each curve. Green brackets represent the increase in junctional myosin fluorescence at the end of pulsing. See Figure S3D for data from single cells. (C) (Left) Time-lapse sequence of a pulsing cell expressing LifeAct-GFP. Purple and yellow colors represent low and high fluorescence intensities, respectively. Time is in minutes and seconds MM:SS. (Right) Scatter dot graph correlating the area fold change (left axis; gray line) and F-actin fluorescence fluctuation (right axis; red line) of pulsing cells. Analysis was performed on N = 3 larvae, and dots represent average values of 182 pulses ± SEM. Green brackets represent the increase in junctional F-actin fluorescence at the end of pulsing. See Figure S3F for data from single cells. (D) Time-lapse sequence of a cell expressing LifeAct-GFP where microridges dissipate overtime. Time is in hours and minutes HH:MM. (E) (Left) MIP of epithelial cells expressing LifeAct-GFP before (green) and after (magenta) laser ablation. Scale bar represents 40 μm. Red dot represents ablated region. (Right) Quantification of the recoil rate in pulsing and non-pulsing regions is shown. (F) (Left) MIP of epithelial cells expressing LifeAct-GFP before (green) and after (magenta) laser ablation. White and red lines contour cell edges before and after ablation, respectively. Scale bar represents 40 μm. Red dot represents ablated region. (Right) Quantification of the recoil rate in DMSO- and MTZ-treated larvae is shown. (G) (Left) 2D slice of epithelial cells expressing NTR-mCherry (magenta). Phosphorylated myosin (P-MLC) is immunostained (green). Scale bar represents 20 μm. (Right) Quantification of junctional P-MLC fluorescence of DMSO- and MTZ-treated larvae is shown. Analysis was performed on 10–20 cells/larva averaged over N = 5–7 larvae/condition over N = 3 separate experiments. (H) Quantification of the apparent stiffness of epithelia in DMSO- and MTZ-treated larvae. See Figure S3I for representative AFM image. |
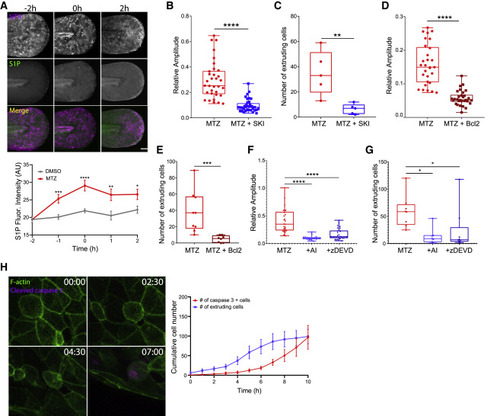
Pulsatile contractions are driven by caspase activity and S1P phosphorylation (A) Upper: MIP of the tail of larvae treated with MTZ overtime. Epithelial cells express NTR-mCherry (magenta), and S1P is immunostained (green). Scale bar represents 100 μm. Lower: scatter dot graph correlating S1P fluorescence of DMSO- and MTZ-treated larvae where t = −2 h represents addition of MTZ and t = 0 corresponds to the start of microscope acquisition. Analysis was performed on N = 30–40 larvae/condition, and dots represent average values ± SEM. See Figure S4A for control analyses of S1P fluorescence. (B) Quantification of the relative amplitude of pulses in larvae treated with MTZ versus MTZ+SKI. See also Video S4. (C) Quantification of the number of extruding cells in larvae treated with MTZ versus MTZ+SKI. See also Video S4. (D) Quantification of the relative amplitude of pulses in NTR- versus NTR+Bcl2-overexpressing larvae treated with MTZ. (E) Quantification of the number of extruding cells in NTR- versus NTR+Bcl2-overexpressing larvae treated with MTZ. See Figures S4B and S4C for control analyses of S1P fluorescence and caspase-3-positive cells. (F) Quantification of the relative amplitude of pulses in larvae treated with MTZ, MTZ+apoptosis inhibitor (NS3694), and MTZ+zDEVD. See also Video S4. (G) Quantification of the number of extruding cells in larvae treated with MTZ, MTZ+apoptosis inhibitor (NS3694), and MTZ+zDEVD. See also Video S4. See Figures S4D and S4E for control analyses of S1P fluorescence and caspase-3-positive cells. (H) Left: time-lapse sequence of epithelial cells from larva treated with MTZ and soaked in NucView 405. Epithelial cells express LifeAct-GFP (green), and cleaved caspase 3 is fluorescently labeled (magenta). Time is in hours and minutes HH:MM. See also Video S5. Right: scatter dot graph representing the number of caspase 3+ cells overtime is shown. Analysis was performed on N = 6 larvae, and dots represent average values ± SEM. See Figure S4F for immunofluorescence-based quantification of caspase-3-positive cells. |
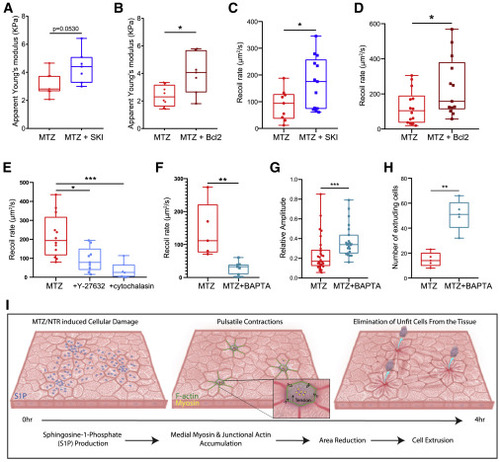
Caspase activation and S1P phosphorylation alter the mechanical state of the tissue following damage (A) Quantification of the apparent stiffness of epithelia of larvae treated with MTZ versus MTZ+SKI. (B) Quantification of the apparent stiffness of epithelia in NTR- versus NTR+Bcl2-overexpressing larvae treated with MTZ. (C) Quantification of the recoil rate in MTZ- versus MTZ+SKI-treated larvae. (D) Quantification of the recoil rate in NTR- versus NTR+Bcl2-overexpressing larvae treated with MTZ. (E) Quantification of the recoil rate in MTZ-, MTZ+Y-27632-, or MTZ+cytochalasin-treated larvae. (F) Quantification of the recoil rate in MTZ- versus MTZ+BAPTA-treated larvae. (G) Quantification of the relative amplitude of pulses in MTZ- versus MTZ+BAPTA-treated larvae. See also Video S6. (H) Quantification of the number of extruding cells in MTZ- versus MTZ+BAPTA-treated larvae. See also Video S6. (I) Upon MTZ treatment, damaged epithelial cells get enriched in S1P. Damage and S1P enrichment lead to decrease in tension within the tissue and induce pulsatile contractions through medio-apical myosin coalescence. Cells that pulse with higher dynamics preferentially extrude. |