
|
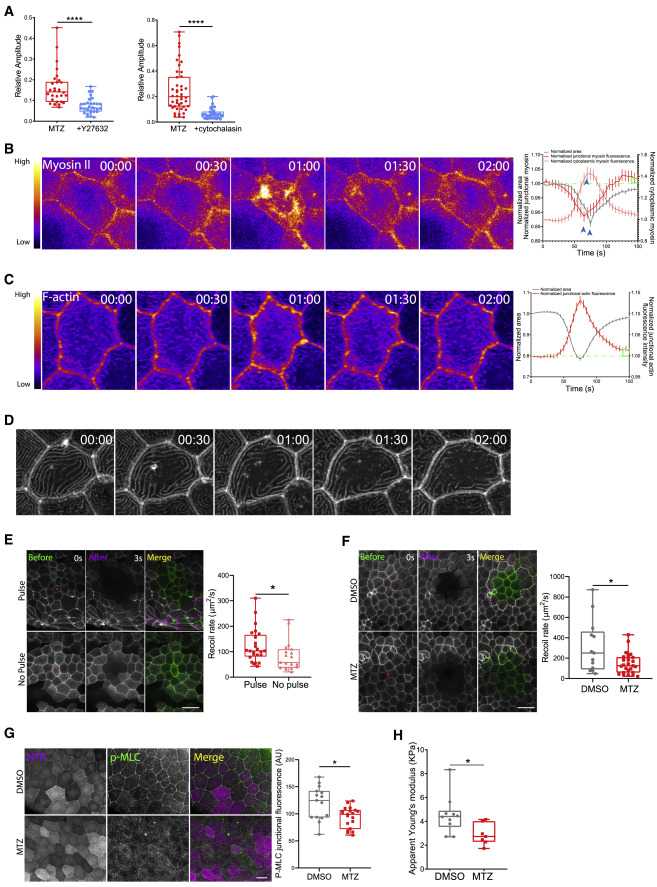
Fig. 3 Tension at the tissue scale is reduced following damage but increases locally to produce pulsing (A) Quantification of the relative amplitude of pulses in larvae treated with MTZ versus MTZ+Y-27632 (left) or MTZ versus MTZ+cytochalasin (right). See also Video S3 and Figure S3A for analysis of the number of extruding cells. (B) (Left) Time-lapse sequence of a pulsing cell expressing myosin II-GFP. Purple and yellow colors represent low and high fluorescence intensities, respectively. Time is in minutes and seconds MM:SS. (Right) Scatter dot graph correlating the area fold change (left axis; gray line) and myosin fluorescence fluctuation (left axis; red and pink lines) of pulsing cells. Analysis was performed on n = 3 larvae, and dots represent average values of 79 pulses ± SEM. Blue arrowheads indicate the peak value of each curve. Green brackets represent the increase in junctional myosin fluorescence at the end of pulsing. See Figure S3D for data from single cells. (C) (Left) Time-lapse sequence of a pulsing cell expressing LifeAct-GFP. Purple and yellow colors represent low and high fluorescence intensities, respectively. Time is in minutes and seconds MM:SS. (Right) Scatter dot graph correlating the area fold change (left axis; gray line) and F-actin fluorescence fluctuation (right axis; red line) of pulsing cells. Analysis was performed on N = 3 larvae, and dots represent average values of 182 pulses ± SEM. Green brackets represent the increase in junctional F-actin fluorescence at the end of pulsing. See Figure S3F for data from single cells. (D) Time-lapse sequence of a cell expressing LifeAct-GFP where microridges dissipate overtime. Time is in hours and minutes HH:MM. (E) (Left) MIP of epithelial cells expressing LifeAct-GFP before (green) and after (magenta) laser ablation. Scale bar represents 40 μm. Red dot represents ablated region. (Right) Quantification of the recoil rate in pulsing and non-pulsing regions is shown. (F) (Left) MIP of epithelial cells expressing LifeAct-GFP before (green) and after (magenta) laser ablation. White and red lines contour cell edges before and after ablation, respectively. Scale bar represents 40 μm. Red dot represents ablated region. (Right) Quantification of the recoil rate in DMSO- and MTZ-treated larvae is shown. (G) (Left) 2D slice of epithelial cells expressing NTR-mCherry (magenta). Phosphorylated myosin (P-MLC) is immunostained (green). Scale bar represents 20 μm. (Right) Quantification of junctional P-MLC fluorescence of DMSO- and MTZ-treated larvae is shown. Analysis was performed on 10–20 cells/larva averaged over N = 5–7 larvae/condition over N = 3 separate experiments. (H) Quantification of the apparent stiffness of epithelia in DMSO- and MTZ-treated larvae. See Figure S3I for representative AFM image.