
Fig. 4
- ID
- ZDB-FIG-210426-27
- Publication
- Atieh et al., 2020 - Pulsatile contractions promote apoptotic cell extrusion in epithelial tissues
- Other Figures
- All Figure Page
- Back to All Figure Page
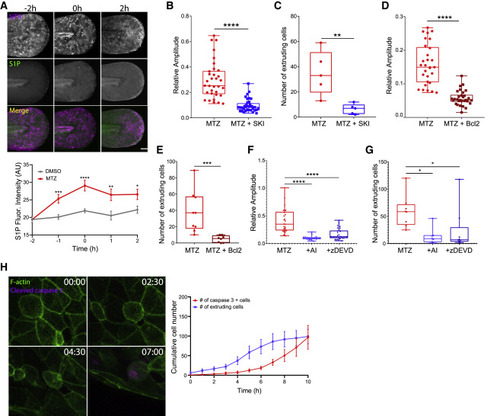
Pulsatile contractions are driven by caspase activity and S1P phosphorylation (A) Upper: MIP of the tail of larvae treated with MTZ overtime. Epithelial cells express NTR-mCherry (magenta), and S1P is immunostained (green). Scale bar represents 100 μm. Lower: scatter dot graph correlating S1P fluorescence of DMSO- and MTZ-treated larvae where t = −2 h represents addition of MTZ and t = 0 corresponds to the start of microscope acquisition. Analysis was performed on N = 30–40 larvae/condition, and dots represent average values ± SEM. See Figure S4A for control analyses of S1P fluorescence. (B) Quantification of the relative amplitude of pulses in larvae treated with MTZ versus MTZ+SKI. See also Video S4. (C) Quantification of the number of extruding cells in larvae treated with MTZ versus MTZ+SKI. See also Video S4. (D) Quantification of the relative amplitude of pulses in NTR- versus NTR+Bcl2-overexpressing larvae treated with MTZ. (E) Quantification of the number of extruding cells in NTR- versus NTR+Bcl2-overexpressing larvae treated with MTZ. See Figures S4B and S4C for control analyses of S1P fluorescence and caspase-3-positive cells. (F) Quantification of the relative amplitude of pulses in larvae treated with MTZ, MTZ+apoptosis inhibitor (NS3694), and MTZ+zDEVD. See also Video S4. (G) Quantification of the number of extruding cells in larvae treated with MTZ, MTZ+apoptosis inhibitor (NS3694), and MTZ+zDEVD. See also Video S4. See Figures S4D and S4E for control analyses of S1P fluorescence and caspase-3-positive cells. (H) Left: time-lapse sequence of epithelial cells from larva treated with MTZ and soaked in NucView 405. Epithelial cells express LifeAct-GFP (green), and cleaved caspase 3 is fluorescently labeled (magenta). Time is in hours and minutes HH:MM. See also Video S5. Right: scatter dot graph representing the number of caspase 3+ cells overtime is shown. Analysis was performed on N = 6 larvae, and dots represent average values ± SEM. See Figure S4F for immunofluorescence-based quantification of caspase-3-positive cells. |