FIGURE SUMMARY
Title

Retrograde mitochondrial transport is essential for organelle distribution and health in zebrafish neurons

Authors
Mandal, A., Wong, H.C., Pinter, K., Mosqueda, N., Beirl, A., Lomash, R.M., Won, S., Kindt, K.S., Drerup, C.M.
Source
Full text @ J. Neurosci.

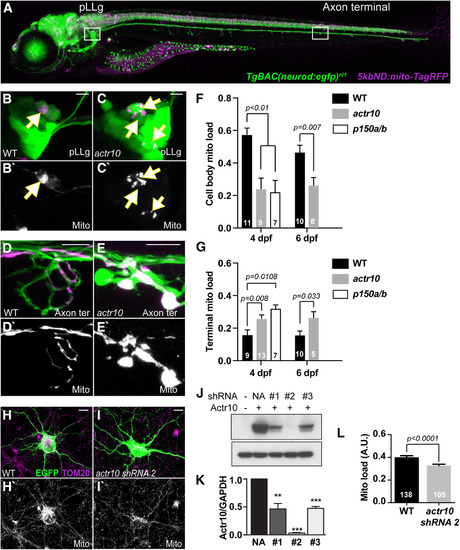
Disruption of retrograde mitochondrial movement impacts mitochondrial distribution in neurons. A, Image of a 4 dpf TgBAC(neurod:egfp)nl1 transgenic zebrafish larva expressing mitochondrially localized TagRFP (shown in magenta) mosaically in neurons. Regions imaged in B, D shown in white boxes. B, C, pLLg neurons have cytosolic GFP and a subset express TagRFP in mitochondria (arrows). In WT animals, mitochondria (magenta in B; white in B') fill the soma. C, In actr10nl15 mutants, cell body mitochondrial area is reduced. D, E, Mitochondria accumulate in axon terminals of actr10nl15 mutants. F, Quantification of cell body mitochondrial load (mitochondrial area/cell body area) at 4 dpf shows a reduction in actr10nl15 and p150a/b mutants (ANOVA); 4 dpf, WT: 0.58 ± 0.04; actr10nl15: 0.24 ± 0.04; p150a/b: 0.21 ± 0.05; 6 dpf, WT: 0.47 ± 0.04; actr10nl15: 0.26 ± 0.05. G, Axon terminal mitochondrial load (mitochondrial area/axon terminal area) at 4 dpf is increased in actr10nl15 and p150a/b mutants (ANOVA). Changes in mitochondrial load are also observed at 6 dpf in actr10nl15 animals; 4 dpf – WT: 0.16 ± 0.03; actr10nl15: 0.26 ± 0.03; p150a/b: 0.31 ± 0.03; 6 dpf, WT: 0.16 ± 0.03; actr10nl15: 0.26 ± 0.04. H–N, shRNA-mediated knock-down of Actr10 in rat hippocampal neurons results in loss of cell body mitochondrial load. Images of hippocampal neuron cell bodies (H, I) stained for TOM20 with a cytoplasmic EGFP fill and either vector only (H) or actr10 shRNA#2 co-transfection (I). Arrows points to mitochondrial in axon terminals. J, K, Western blotting and quantification showing knock-down of Actr10 by the shRNAs tested in HEK cells (top, Actr10; bottom, GAPDH; **p < 0.01, ***p < 0.005; ANOVA; n = 3). L, Quantification of mitochondrial load in Actr10 knock-down hippocampal neurons (ANOVA). WT: 0.40 ± 0.01; actr10 shRNA2: 0.32 ± 0.01. Sample sizes (F, G, number of larvae; L, number of neurons) indicated on graph. Scale bars: 10 µm. All data are mean ± SEM.

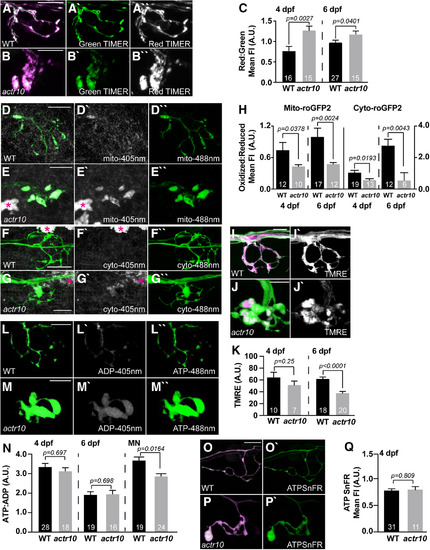
Loss of retrograde mitochondrial transport results in altered measures of mitochondrial health. A, B, TIMER fluorescence in the intermembrane space of mitochondria in the axon terminal of WT and actr10nl15 mutants at 4 dpf. Oxidized TIMER, magenta/white; reduced TIMER, green. C, Quantification of the oxidized:reduced TIMER protein at 4 and 6 dpf demonstrates cumulative oxidation of the TIMER protein in axon terminal mitochondria with retrograde transport reduction (ANOVA); 4 dpf, WT: 0.78 ± 0.10; actr10nl15: 1.27 ± 0.11; 6 dpf, WT: 0.98 ± 0.06; actr10nl15: 1.18 ± 0.08. D–H, roGFP2 reveals acute changes in ROS levels in mitochondria of actr10nl15 mutants. D, E, Mitochondrially localized roGFP2 (localized to the intermembrane space) in axon terminals of WT and actr10nl15 mutants at 4 dpf. F, G, Cytoplasmic roGFP2 expression in axon terminals of WT and actr10nl15 mutants at 4 dpf. Asterisks on autofluorescent pigment cells. H, Quantification of the ratio of oxidized to reduced roGFP2 in mitochondria (left) or cytosol (right) of the axon terminal at 4 and 6 dpf (ANOVA or Wilcoxon rank-sum). Mitochondrial: 4 dpf, WT: 0.74 ± 0.11; actr10nl15: 0.43 ± 0.12; 6 dpf, WT: 0.99 ± 0.13; actr10nl15: 0.47 ± 0.16. Cytoplasmic: 4 dpf, WT: 1.08 ± 0.13; actr10nl15: 0.56 ± 0.16; 6 dpf, WT: 2.88 ± 0.45; actr10nl15: 0.66 ± 0.64. I, J, TMRE staining (magenta in merge; white in single channel) of the mitochondrial matrix in axon terminals at 4 dpf. Neurons are labeled with cytosolic GFP. K, Mean TMRE fluorescence is slightly reduced at 4 dpf and significantly decreased in axon terminal mitochondria at 6 dpf when retrograde mitochondrial transport is inhibited (ANOVA); 4 dpf, WT: 64.98 ± 8.07; actr10nl15: 52.41 ± 6.75; 6 dpf, WT: 61.94 ± 3.08; actr10nl15: 37.89 ± 2.92. L, M, WT and actr10nl15 mutant axon terminals expressing PercevalHR at 4 dpf. N, Quantification of the ATP:ADP ratio at 4 and 6 dpf shows no change in actr10nl15 mutants (ANOVA); 4 dpf, WT: 3.40 ± 0.20; actr10nl15: 3.09 ± 0.25; 6 dpf, WT: 1.81 ± 0.20; actr10nl15: 1.70 ± 0.20. ATP:ADP ratios are decreased in motor neuron (MN) axons at 4 dpf in actr10nl15 mutants (ANOVA). WT: 3.73 ± 0.20; actr10nl15: 2.78 ± 0.18. O–Q, ATPSnFR analysis of cytosolic ATP levels at 4 dpf. Magenta, cytosolic mRuby; green, ATPSnFR. O, P, Expression of 5kbneurod:mRuby-ATPSnFR in a single WT and actr10nl15 mutant axon terminal. Q, Quantification of the ATPSnFR fluorescence intensity normalized to mRuby expression shows no difference in ATP levels between WT and actr10nl15 mutant axon terminals (ANOVA). WT: 0.80 ± 0.03; actr10nl15: 0.81 ± 0.06. Sample sizes indicated on graph. Scale bar: 10 µm. All data are mean ± SEM.

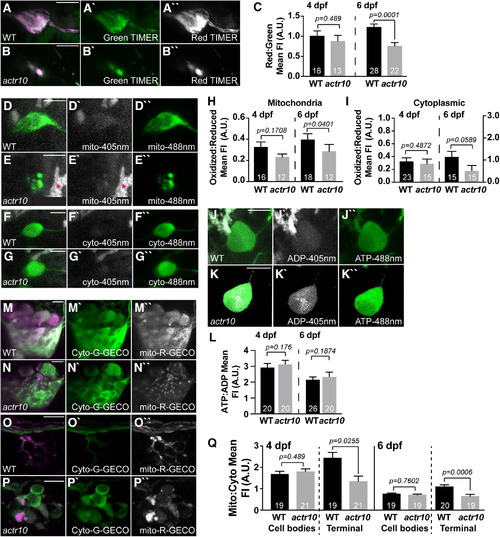
Mitochondrial calcium load is decreased in axon terminal mitochondria in actr10nl15 mutants. A–C, TIMER fluorescence in the cell body mitochondria show lower cumulative ROS exposure by 6 dpf with retrograde mitochondrial transport inhibition (ANOVA); 4 dpf, WT: 1.01 ± 0.12; actr10nl15: 0.88 ± 0.14; 6 dpf, WT: 1.23 ± 0.08; actr10nl15: 0.76 ± 0.08. D–I, roGFP2 expression in mitochondria and the cytosol of the cell body shows no change in acute ROS at 4 or 6 dpf in actr10nl15 mutants (ANOVA). Mitochondrial: 4 dpf, WT: 0.33 ± 0.04; actr10nl15: 0.23 ± 0.05; 6 dpf, WT: 0.40 ± 0.05; actr10nl15: 0.29 ± 0.07. Cytoplasmic: 4 dpf, WT: 0.34 ± 0.06; actr10nl15: 0.29 ± 0.07; 6 dpf, WT: 1.17 ± 0.27; actr10nl15: 0.52 ± 0.29. J–L, Cell body ATP:ADP ratios, measured using PercevalHR expression, are unchanged in actr10nl15 mutants (ANOVA); 4 dpf, WT: 3.01 ± 0.29; actr10nl15: 3.14 ± 0.29; 6 dpf, WT: 2.12 ± 0.23; actr10nl15: 2.34 ± 0.26. M–Q, Cell bodies (M, N) and axon terminals (O, P) expressing mitochondrially localized R-GECO (magenta in merge, white in single channel) and cytoplasmic G-GECO (green) in WT and actr10nl15 mutants at 4 dpf. Q, Quantification of mitochondrial:cytoplasmic GECO signal at 4 and 6 dpf in the pLLg and axon terminals (ANOVA or Wilcoxon rank-sum). Ganglion: 4 dpf, WT: 1.69 ± 0.13; actr10nl15: 1.81 ± 0.12; 6 dpf, WT: 0.70 ± 0.04; actr10nl15: 0.66 ± 0.04. Axon terminal: 4 dpf, WT: 2.45 ± 0.25; actr10nl15: 1.35 ± 0.24; 6 dpf, WT: 1.02 ± 0.08; actr10nl15: 0.60 ± 0.08. Sample sizes indicated on graph. Scale bar: 10 µm. All data are mean ± SEM.

Postsynaptic axon response to stimulation is unaffected by mitochondrial health. A, Schematic of the neural circuit in a sensory neuromast of the pLL. Apical stereocilia on HCs are deflected by water movement and signal through ribbon synapses to afferent (postsynaptic) axons. Support cells surround HCs. B, C, actr10nl15 mutants have fewer sensory HCs as assayed by Myosin VIIa immunolabeling. D, D', HC and synapse number is rescued by expressing RFP-tagged Actr10 in HCs (HC rescue) using the Tg(myo6b:mRFP-actr10)y610 transgenic. Ribeye: presynapse; MAGUK: postsynapse. E–G, GCaMP6s expression in an axon terminal of a WT (E), actr10nl15 mutant (F), and actr10nl15 mutant with HC rescue (G) at 5 dpf. E'–G', Shown are spatial patterns of GCaMP6s signal increases in afferent terminals during stimulation. GCaMP6s signals are colorized according to the dF/F0 heat maps and are superimposed onto a prestimulus baseline GCaMP6s image. H, H', The average change in GCaMP6s fluorescence intensity on stimulation, shown in plots (H) and quantification (H': WT: 73.26 ± 10.62; actr10nl15: 1.53 ± 0.76; actr10nl15+HC rescue: 43 ± 7.78), revealed a reduction in actr10nl15 mutants with and without HC rescue (ANOVA). Black dotted lines represent SEM. I, J, Actr10 rescue in axons using mosaic expression of the 5kbneurod:mRFP-actr10 transgene (axon rescue) in the background of the Tg(myo6b:mRFP-actr10 y610 transgenic (HC rescue). K, Rescuing Actr10 in neurons does not rescue postsynaptic axonal activity based on average GCaMP6s fluorescence (t test). WT: 50.90 ± 8.45; WT+HC rescue: 54.52 ± 16.0; actr10nl15: 20.69 ± 5.37; actr10nl15+HC rescue: 26.65 ± 4.45. Sample sizes indicated on graph. Scale bar: 10 µm. All data are mean ± SEM.

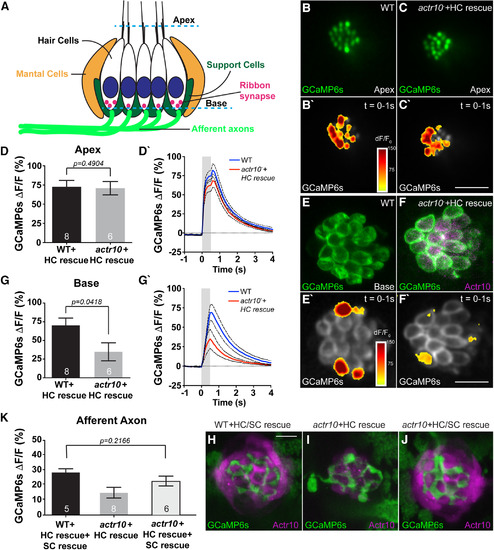
Loss of support cells (SCs) underlies the loss of postsynaptic activity in actr10nl15 mutants. A, Schematic of the neuromast indicating the “apex” of the HC where mechanotransduction takes place in stereocilia and the “base” of the HC where the presynaptic activity occurs. B, C, WT and actr10nl15 mutants with HC rescue at 5 dpf show similar mechanotransduction in HC stereocilia (Apex). B', C', Heat map of Apex GCaMP6s fluorescence intensity changes during stimulation. D, D', Quantification reveals no difference in the average change in Apex GCaMP6s fluorescence intensity between WT and actr10nl15 mutants with HC rescue (t test). WT+HC rescue: 72.73 ± 8.24; actr10nl15+HC rescue: 70.85 ± 8.71. Black dotted lines represent standard error of the mean. E, F, Compared with WT, actr10nl15 HC rescue mutants show reduced calcium influx at the presynapse. E', F', Heat map of GCaMP6s fluorescence intensity changes at the HC base during stimulation. G, G', Quantification of the change in Base GCaMP6s fluorescence is significantly different between WT and actr10nl15 mutants with HC rescue (t test). WT+HC rescue: 70.09 ± 9.93; actr10nl15+HC rescue: 34.81 ± 12.05. H–J, Rescue of Actr10 expression in actr10nl15 SCs in the Tg(She:actr10p2amRFP)y623/Tg(myo6b:mRFP-actr10)y610 double transgenic line. H, WT sibling with HC and SC expression of Actr10. I, actr10nl15 mutant with only HC rescue. J, actr10nl15 mutant with HC/SC double rescue. K, GCaMP6s responses in the axon terminal are normal in actr10nl15 mutant with SC and HC rescue but not with HC rescue alone (ANOVA). WT+HC/SC rescue: 28.05 ± 3.50; actr10nl15+HC rescue: 17.10 ± 3.08; actr10nl15+HC/SC rescue: 23.66 ± 3.26. Sample size indicated on graph. Scale bars: 10 µm. All data are mean ± SEM.

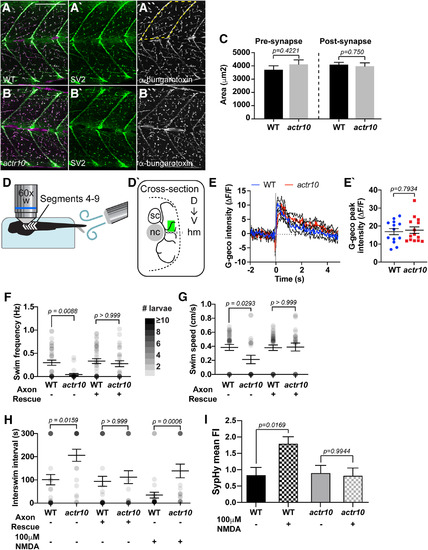
Motor neuron function is decreased in actr10nl15 mutants. A, B, Antibody labeling of larval neuromuscular junctions at 4 dpf revealed no difference between WT (A) and actr10nl15 mutants (B). C, Quantification of total presynaptic and postsynaptic area in dorsal somite (area outlined by dotted line in A''). Presynapse WT: 3705 ± 390; actr10nl15: 4114 ± 302. Postsynapse WT: 4088 ± 285; actr10nl15: 3971 ± 220. D, Schematic of motor neuron axon calcium imaging. Larvae are paralyzed and immobilized in agarose with tail freed for stimulation and randomly oriented such that either left or right side of body segments 4–9 faces the objective. D', Cross-section of recording area. Motor neuron (black lines) expressing cell-fill G-Geco originate from the spinal cord (sc). Motor neuron terminals were randomly selected in a region (green rectangle) dorsal to the horizontal myoseptum (gray dotted line; hm) and lateral to the notochord (nc). E, Average temporal traces of evoked terminal G-Geco signals (ΔF/F0). Black dotted lines represent SEM. E', Scatterplot of peak terminal-Ca2+ response in WT (blue) or actr10nl15 mutants (red) show no change in response in mutants. WT: 16.9 ± 1.726; actr10nl15: 17.72 ± 1.815. F–H, Dot plots show spontaneous swim frequency, speed, and time interval between swim bouts, respectively. Dot intensity (grayscale) corresponds to number of larvae at each point with darker values indicating more larvae displayed the behavior. actr10nl15 mutants swim less frequently and are slower than WT siblings. These behavioral deficits are rescued with neuronal Actr10 expression. Frequency, WT: 0.2986 ± 0.056; actr10nl15: 0.042 ± 0.023; WT+Axon rescue: 0.333 ± 0.052; actr10nl15+Axon rescue: 0.277 ± 0.063. Speed, WT: 0.384 ± 0.043; actr10nl15: 0.212 ± 0.061; WT+Axon rescue: 0.380 ± 0.040; actr10nl15+Axon rescue: 0.390 ± 0.056. Interswim interval, WT: 101 ± 22.31; actr10nl15: 206 ± 26.05; WT+Axon rescue: 93.89 ± 21.39; actr10nl15+Axon rescue: 112 ± 27.68. H, NMDA treatment decreases interswim intervals but actr10nl15 mutants still swim less frequently than WT siblings. WT: 30.64 ± 12.68; actr10nl15: 136 ± 29.97. I, SypHy mean fluorescence (normalized to mRFP fill); 100 μm NMDA increases SypHy fluorescence in WT but not actr10nl15 mutants, indicating no increase in synaptic vesicle release. WT: 0.84 ± 0.233; WT+NMDA: 1.80 ± 0.214. actr10nl15: 0.901 ± 0.219; actr10nl15 +NMDA: 0.821 ± 0.219. Scale bars: 100 µm. All data are mean ± SEM.

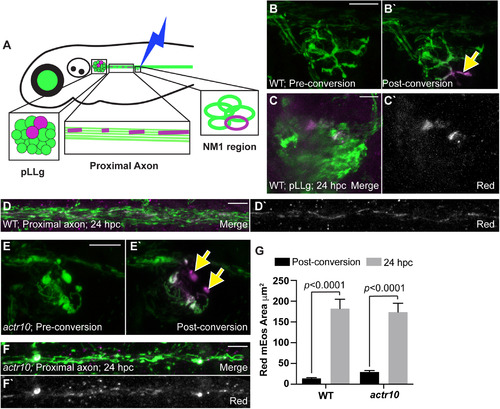
Mitochondrial retrograde transport is required for mitochondrial turnover in axon terminals. A, Schematic of mitochondrial photoconversion assay using the Tg(5kbneurod:mito-mEos)y568 transgenic zebrafish. pLL axon terminals of the terminal cluster (ter) are depicted in the inset. A, B, Photoconversion of mitochondria in a WT pLL axon terminal results in a permanent switch from green to red (red is shown in magenta) of the mitochondrially localized mEos (photoconversion at 4 dpf). These converted mitochondria are gone 24 h postphotoconversion (hpc). C, Quantification of the gain of new (green) and loss of old (magenta) mitochondria from axon terminals 24 hpc (ANOVA; Tukey's HSD post hoc contrasts; n = 8 each). Green pre: 252.12 ± 31.44; green post: 103.99 ± 13.55; green 24 hpc: 183.05 ± 26.04; red pre: 23.50 ± 13.59; red post: 90.79 ± 15.20; red 24 hpc: 20.80 ± 4.93. D, pLL axon terminal mitochondria at 6 dpf show similar levels of mitochondrial turnover to that observed at 4 dpf (ANOVA; n = 21). Green pre: 155.06 ± 8.14; green post: 39.78 ± 4.74; green 24 hpc: 173.50 ± 21.87; red pre: 1.67 ± 0.15; red post: 123.63 ± 9.04; red 24 hpc: 35.56 ± 3.85. E, Motor neuron axons show similar levels of mitochondrial turnover compared with pLL sensory axons in 24 h (ANOVA; n = 13). Green pre: 102.58 ± 13.38; green post: 25.69 ± 2.50; green 24 hpc: 62.69 ± 7.37; red pre: 1.41 ± 0.15; red post: 42.16 ± 7.04; red 24 hpc: 18.31 ± 2.90. F, Time-lapse imaging of mitochondrial turnover in pLL axon terminals reveals that 50% of mitochondria have left the axon terminal by 108 min postconversion (1 min: n = 4; 3 min: n = 2; 10 min: n = 2). G–K, Photoconversion of mEos-labeled mitochondria in HCs of the pLL showed no significant loss of red mEos until 72 hpc (ANOVA with post hoc contrasts; n = 12). Day 4: 228 ± 19.26; day 5: 193.98 ± 27.91; day 6: 167.95 ± 26.35; day 7: 153.24 ± 26.01. L, M, Photoconversion of axon terminal mitochondria followed by treatment with lysosomal inhibitors pepstatin A and E64D (10 µg/ml for ∼18 h) did not impair mitochondrial turnover in pLL axon terminals. N, Quantification of mitochondrial turnover with lysosomal inhibition (ANOVA; n = 11). DMSO control: green pre: 391.75 ± 32.26; green post: 61.61 ± 5.98; green 24 hpc: 239.13 ± 20.72; red pre: 5.02 ± 1.16; red post: 269.86 ± 28.07; red 24 hpc: 46.24 ± 5.44. Pepstatin A/E64D: green pre: 287.63 ± 51.72; green post: 36.88 ± 4.85; green 24 hpc: 194.22 ± 37.30; red pre: 1.92 ± 0.21; red post: 216.81 ± 44.20; red 24 hpc: 55.76 ± 23.12. O, Photoconversion of mitochondrially-localized mEos in a pLL axon terminal of an actr10nl15 mutant. P, Quantification of new (green) and old (magenta) mitochondria shows persistence of converted mitochondria in pLL axon terminals when retrograde transport is disrupted (ANOVA; Tukey's HSD post hoc contrasts; n = 6). Green pre: 651.94 ± 104.49; green post: 248.06 ± 51.95; green 24 hpc: 325.04 ± 55.11; red pre: 5.12 ± 1.05; red post: 243.56 ± 47.47; red 24 hpc: 210.60 ± 42.90. Pre, before conversion; post, immediately after conversion. Scale bars: 10 µm. All data are mean ± SEM.

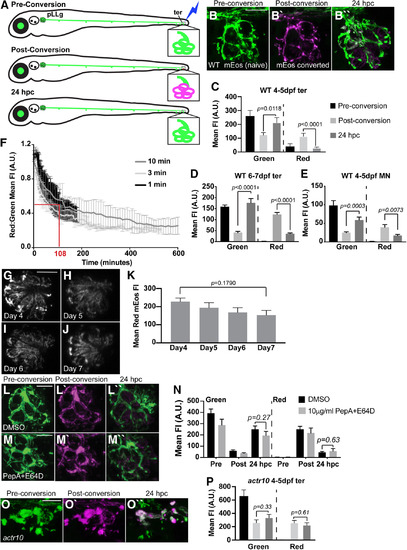
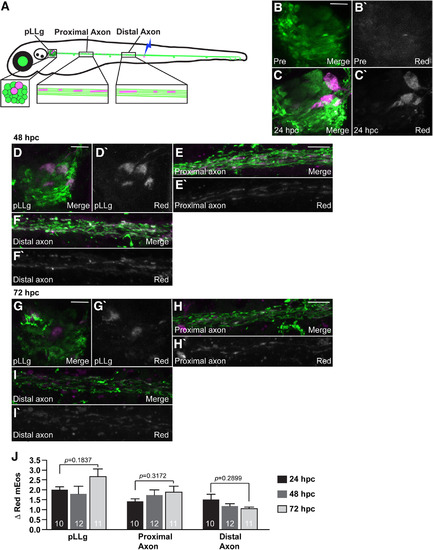
mEos can be redistributed independent of retrograde transport in pLL neurons. A, Schematic of the minimal mitochondrial photoconversion strategy and the regions analyzed for mitochondrial area at 24 hpc. B, Images of a WT axon terminal before and immediately after photoconversion. Green: naive mEos; magenta: converted mEos. Arrow points to region photoconverted. C, D, The pLLg and proximal axon at 24 hpc shows mitochondrially localized converted (magenta in merge, white alone) mEos in the cell body and mitochondria along the axon. E, An actr10nl15 mutant axon terminal before and immediately after photoconversion. F, The proximal axon of an actr10nl15 mutant 24 hpc showing converted mEos in mitochondria in the axon. G, Quantification of the total area of converted mEos fluorescence immediately postconversion and at 24 hpc (ANOVA; WT: n = 9; actr10nl15: n = 13). Postconversion: WT: 14.16 ± 2.97; actr10nl15: 29.52 ± 2.60. 24 hpc: WT: 181.98 ± 23.70; actr10nl15: 173.55 ± 20.79. Scale bars: 10 µm. All data are mean ± SEM.

Mitochondrially localized mEos persists for days in neurons. A, Schematic of the photoconversion and tracking strategy. At 4 dpf, pLL axon terminal mitochondria in the NM3 sensory organ (mid-trunk) were photoconverted. At 24, 48, and 72 hpc, the pLLg, proximal axon, and distal axon were imaged. B, C, 24 hpc, mitochondrially localized, converted mEos that originated from the axon terminal is now redistributed to the neuronal cell bodies (magenta or white). We expect two to four neurons have axon terminals in this region at 4 dpf. D–F, 48 hpc, mitochondria converted in NM3 axon terminals are present in the associated cell bodies, proximal, and distal axons of the neuron. G–I, Similarly, 72 hpc mitochondria labeled in the NM3 axon terminals are present throughout the neurons from the cell bodies to the distal axon. J, Quantification of the change in red (converted) fluorescence intensity shows that mitochondrially localized mEos persists in the neuron through 72 hpc (n = 12 larvae each; ANOVA; Tukey's HSD post hoc contrasts). pLLg: 24 hpc: 2.10 ± 0.18; 48 hpc: 1.81 ± 0.38; 72 hpc: 2.69 ± 0.38. Proximal axon: 24 hpc: 1.37 ± 0.16; 48 hpc: 1.75 ± 0.26; 72 hpc: 1.91 ± 0.29; distal axon: 24 hpc: 1.21 ± 0.11; 48 hpc: 1.20 ± 0.09; 72 hpc: 1.08 ± 0.01. Scale bars: 10 µm. All data are mean ± SEM.

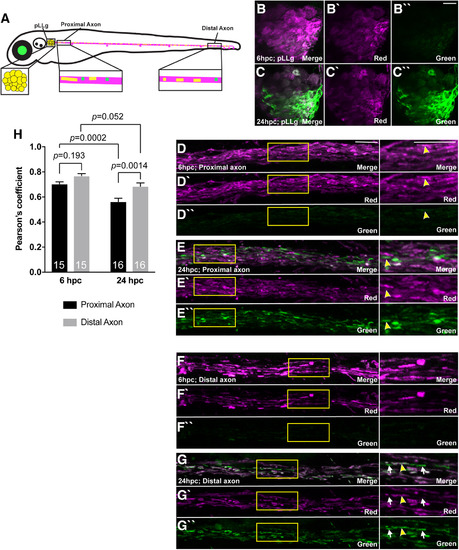
A strong correlation between red and green mEos 24 hpc suggests protein mixing within existing organelles. A, Schematic of the photoconversion and tracking assay. At 4 dpf, the whole larva was photoconverted, and then 6 and 24 hpc, the boxed regions were imaged. B–G, Imaging at 6 and 24 hpc of the whole larva shows gradual gain of new (green) mEos in the cell bodies of the pLLg (B, C), proximal axon (D, E), and distal axons (F, G) of the pLL. For D–G, boxed region is shown at a higher magnification on the right. Arrowheads point to mitochondria with strong green fluorescence and consistent red (converted) fluorescence as well. Arrows point to mitochondria that lack converted mEos. H, Correlational analysis of green and red mEos at 6 and 24 hpc (ANOVA with Tukey's HSD post hoc contrasts; n = 8). Green signal was converted into a mask to assay the presence of red (converted) fluorescence that overlapped. Proximal axon: 6 hpc: 0.70 ± 0.01; 24 hpc: 0.56 ± 0.02; Distal axon: 6 hpc: 0.77 ± 0.02; 24 hpc: 0.69 ± 0.03. Scale bar: 10 µm. Sample size on graph. All data are ±SEM.

Acknowledgments
This image is the copyrighted work of the attributed author or publisher, and ZFIN has permission only to display this image to its users. Additional permissions should be obtained from the applicable author or publisher of the image. Full text @ J. Neurosci.