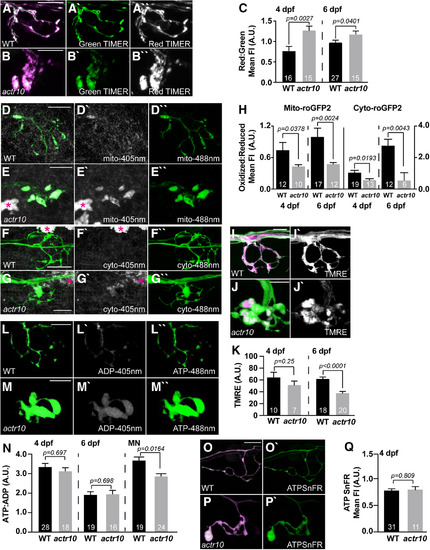
Loss of retrograde mitochondrial transport results in altered measures of mitochondrial health. A, B, TIMER fluorescence in the intermembrane space of mitochondria in the axon terminal of WT and actr10nl15 mutants at 4 dpf. Oxidized TIMER, magenta/white; reduced TIMER, green. C, Quantification of the oxidized:reduced TIMER protein at 4 and 6 dpf demonstrates cumulative oxidation of the TIMER protein in axon terminal mitochondria with retrograde transport reduction (ANOVA); 4 dpf, WT: 0.78 ± 0.10; actr10nl15: 1.27 ± 0.11; 6 dpf, WT: 0.98 ± 0.06; actr10nl15: 1.18 ± 0.08. D–H, roGFP2 reveals acute changes in ROS levels in mitochondria of actr10nl15 mutants. D, E, Mitochondrially localized roGFP2 (localized to the intermembrane space) in axon terminals of WT and actr10nl15 mutants at 4 dpf. F, G, Cytoplasmic roGFP2 expression in axon terminals of WT and actr10nl15 mutants at 4 dpf. Asterisks on autofluorescent pigment cells. H, Quantification of the ratio of oxidized to reduced roGFP2 in mitochondria (left) or cytosol (right) of the axon terminal at 4 and 6 dpf (ANOVA or Wilcoxon rank-sum). Mitochondrial: 4 dpf, WT: 0.74 ± 0.11; actr10nl15: 0.43 ± 0.12; 6 dpf, WT: 0.99 ± 0.13; actr10nl15: 0.47 ± 0.16. Cytoplasmic: 4 dpf, WT: 1.08 ± 0.13; actr10nl15: 0.56 ± 0.16; 6 dpf, WT: 2.88 ± 0.45; actr10nl15: 0.66 ± 0.64. I, J, TMRE staining (magenta in merge; white in single channel) of the mitochondrial matrix in axon terminals at 4 dpf. Neurons are labeled with cytosolic GFP. K, Mean TMRE fluorescence is slightly reduced at 4 dpf and significantly decreased in axon terminal mitochondria at 6 dpf when retrograde mitochondrial transport is inhibited (ANOVA); 4 dpf, WT: 64.98 ± 8.07; actr10nl15: 52.41 ± 6.75; 6 dpf, WT: 61.94 ± 3.08; actr10nl15: 37.89 ± 2.92. L, M, WT and actr10nl15 mutant axon terminals expressing PercevalHR at 4 dpf. N, Quantification of the ATP:ADP ratio at 4 and 6 dpf shows no change in actr10nl15 mutants (ANOVA); 4 dpf, WT: 3.40 ± 0.20; actr10nl15: 3.09 ± 0.25; 6 dpf, WT: 1.81 ± 0.20; actr10nl15: 1.70 ± 0.20. ATP:ADP ratios are decreased in motor neuron (MN) axons at 4 dpf in actr10nl15 mutants (ANOVA). WT: 3.73 ± 0.20; actr10nl15: 2.78 ± 0.18. O–Q, ATPSnFR analysis of cytosolic ATP levels at 4 dpf. Magenta, cytosolic mRuby; green, ATPSnFR. O, P, Expression of 5kbneurod:mRuby-ATPSnFR in a single WT and actr10nl15 mutant axon terminal. Q, Quantification of the ATPSnFR fluorescence intensity normalized to mRuby expression shows no difference in ATP levels between WT and actr10nl15 mutant axon terminals (ANOVA). WT: 0.80 ± 0.03; actr10nl15: 0.81 ± 0.06. Sample sizes indicated on graph. Scale bar: 10 µm. All data are mean ± SEM.
|
