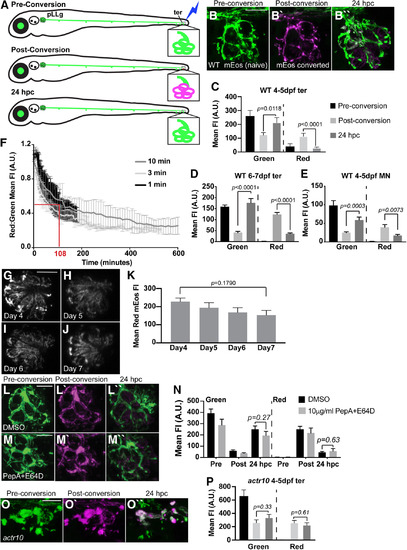
Mitochondrial retrograde transport is required for mitochondrial turnover in axon terminals. A, Schematic of mitochondrial photoconversion assay using the Tg(5kbneurod:mito-mEos)y568 transgenic zebrafish. pLL axon terminals of the terminal cluster (ter) are depicted in the inset. A, B, Photoconversion of mitochondria in a WT pLL axon terminal results in a permanent switch from green to red (red is shown in magenta) of the mitochondrially localized mEos (photoconversion at 4 dpf). These converted mitochondria are gone 24 h postphotoconversion (hpc). C, Quantification of the gain of new (green) and loss of old (magenta) mitochondria from axon terminals 24 hpc (ANOVA; Tukey's HSD post hoc contrasts; n = 8 each). Green pre: 252.12 ± 31.44; green post: 103.99 ± 13.55; green 24 hpc: 183.05 ± 26.04; red pre: 23.50 ± 13.59; red post: 90.79 ± 15.20; red 24 hpc: 20.80 ± 4.93. D, pLL axon terminal mitochondria at 6 dpf show similar levels of mitochondrial turnover to that observed at 4 dpf (ANOVA; n = 21). Green pre: 155.06 ± 8.14; green post: 39.78 ± 4.74; green 24 hpc: 173.50 ± 21.87; red pre: 1.67 ± 0.15; red post: 123.63 ± 9.04; red 24 hpc: 35.56 ± 3.85. E, Motor neuron axons show similar levels of mitochondrial turnover compared with pLL sensory axons in 24 h (ANOVA; n = 13). Green pre: 102.58 ± 13.38; green post: 25.69 ± 2.50; green 24 hpc: 62.69 ± 7.37; red pre: 1.41 ± 0.15; red post: 42.16 ± 7.04; red 24 hpc: 18.31 ± 2.90. F, Time-lapse imaging of mitochondrial turnover in pLL axon terminals reveals that 50% of mitochondria have left the axon terminal by 108 min postconversion (1 min: n = 4; 3 min: n = 2; 10 min: n = 2). G–K, Photoconversion of mEos-labeled mitochondria in HCs of the pLL showed no significant loss of red mEos until 72 hpc (ANOVA with post hoc contrasts; n = 12). Day 4: 228 ± 19.26; day 5: 193.98 ± 27.91; day 6: 167.95 ± 26.35; day 7: 153.24 ± 26.01. L, M, Photoconversion of axon terminal mitochondria followed by treatment with lysosomal inhibitors pepstatin A and E64D (10 µg/ml for ∼18 h) did not impair mitochondrial turnover in pLL axon terminals. N, Quantification of mitochondrial turnover with lysosomal inhibition (ANOVA; n = 11). DMSO control: green pre: 391.75 ± 32.26; green post: 61.61 ± 5.98; green 24 hpc: 239.13 ± 20.72; red pre: 5.02 ± 1.16; red post: 269.86 ± 28.07; red 24 hpc: 46.24 ± 5.44. Pepstatin A/E64D: green pre: 287.63 ± 51.72; green post: 36.88 ± 4.85; green 24 hpc: 194.22 ± 37.30; red pre: 1.92 ± 0.21; red post: 216.81 ± 44.20; red 24 hpc: 55.76 ± 23.12. O, Photoconversion of mitochondrially-localized mEos in a pLL axon terminal of an actr10nl15 mutant. P, Quantification of new (green) and old (magenta) mitochondria shows persistence of converted mitochondria in pLL axon terminals when retrograde transport is disrupted (ANOVA; Tukey's HSD post hoc contrasts; n = 6). Green pre: 651.94 ± 104.49; green post: 248.06 ± 51.95; green 24 hpc: 325.04 ± 55.11; red pre: 5.12 ± 1.05; red post: 243.56 ± 47.47; red 24 hpc: 210.60 ± 42.90. Pre, before conversion; post, immediately after conversion. Scale bars: 10 µm. All data are mean ± SEM.
|
