
- Title
-
Comparative genomic analysis of human GLI2 locus using slowly evolving fish revealed the ancestral gnathostome set of early developmental enhancers
- Authors
- Ali, S., Arif, I., Iqbal, A., Hussain, I., Abrar, M., Khan, M.R., Shubin, N., Abbasi, A.A.
- Source
- Full text @ Dev. Dyn.

Multispecies comparative plot of human GLI2 locus. Multispecies comparative analysis of human GLI2 locus and 100 kb flanking region from both directions with orthologous counterparts of tetrapods (mouse, chicken and lizard) and aquatic vertebrates (coelacanth, fugu, spotted gar, and elephant shark). Presented here are visualization tool for alignment (VISTA) graphical output by Shuffle-LAGAN tool using human sequence as the baseline. The black arrow above the plot shows the direction of transcription and length of GLI2 gene (257 kb). The conserved noncoding elements highlighted in light green and indicated on top as red numbers, are selected for functional analysis in this study. CNEs indicated in black are reported previously by our research group.28 Criteria of alignment were 50 bp and 50% conservation cutoff. Conserved coding and noncoding sequences are depicted in blue and pink peaks, respectively. Y-axis indicates percent identity and x-axis indicates the length of sequences. kb, kilobase; Ex, exon; CNE, conserved noncoding element |
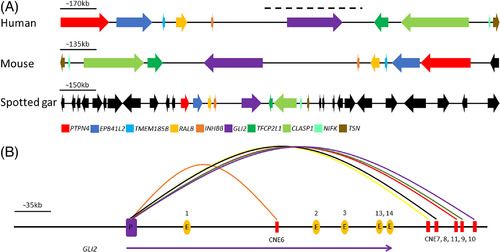
Syntenic mapping of GLI2 locus and GLI2 promoter physical interaction with intragenic and intergenic CNEs. Panel A: Comparative syntenic investigation of human-mouse and spotted gar Gli2 containing orthologous loci reveals the deep conservation of this genomic block down to fish. This 2 MB orthologous block consists of conserved genes GLI2, TFCP2L1, CLASP1, NIFK, TSN, INHBB, RALB, TMEM185B, EPB41L5, PTTPN4. The endogenous expression pattern analysis and orthology mapping failed to exclusively associate CNEs identified in the present study with a single gene body. Conserved genes are color coded (other than black), whereas non-conserved genes are depicted in black. The genic architecture of loci is drawn according to the approximate scale (blackline). The black dashed line on top of GLI2 locus showing the region presented in Panel B. Panel B: The virtual 4C data obtained from the 3D genome browser shows the physical interaction of intragenic and intergenic CNEs with GLI2 promoter. The blue rectangle depicts GLI2 promoter while CNEs are depicted as red rectangles. The orange ovals are GLI2 exons. The parabolas direct the CNEs interaction with promoter. The purple arrowhead underneath depicts the direction of GLI2 transcription |

Subset of GLI2-associated CNEs depict seemingly redundant enhancer activity in the pectoral fin-bud of zebrafish. Representative images of live zebrafish transgenic embryos are shown (merged bright-field and fluorescent microscopy), orientation of the embryos is anterior to left, dorsal to top with lateral views. White arrowheads point to the GFP signals in transgenic zebrafish expressing cells in the developing pectoral fin at 48 hpf, A-C, induced by CNE6, CNE7, and CNE8, respectively. CNE6 is GLI2 intragenic element while CNE7 and CNE8 are intergenic elements. hpf, hours postfertilization; pf, pectoral fin; y, yolk sac |

CNE10 and CNE11 induced the reporter gene expression in the brain and spinal cord. Representative images of live zebrafish transgenic embryos are shown (merged bright-field and fluorescent microscopy), orientation of the embryo is anterior to left, dorsal to top with lateral views. White arrowheads point to the GFP signals in transgenic zebrafish expressing cells in the forebrain at 24 hpf, A, and hindbrain and spinal cord at 48 hpf, B,C. hpf, hours postfertilization; fb, forebrain; hb, hindbrain; sc, spinal cord; y, yolk sac |

Heart specific cis-regulatory activity was observed for CNE6 and CNE9. Transgenic zebrafish embryos expressing the reporter gene are shown (merged bright-field and fluorescent microscopy), lateral view in panels A, B, C and ventral view in panel D. The white arrowhead points to the reporter gene signal of transgenic zebrafish expressing cells in developing heart at 48 hpf, A, induced by CNE6, 24 hpf, B, and 48 hpf, C,D, induced by CNE9. hpf, hours postfertilization; h, heart; y, yolk sac |
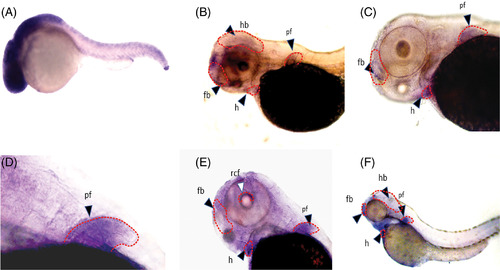
Whole mount in situ hybridization of gli2a in developing zebrafish embryos. Expression of Zebrafish gli2a mRNA during embryogenesis determined by whole mount in situ hybridization. A, 24 hpf lateral view. B,C, 50 hpf lateral view. D, 48 hpf lateral view of pectoral fin with high resolution. E,F, 48 hpf lateral view. At 24 hpf, the expression is not spatially restricted as gli2a is ubiquitously expressed, A. At 48 and 50 hpf, staining is lost from most of the trunk and tail but is still strong in the epidermis, dorsal CNS, pectoral fin, branchial arches, and retina choroid fissure. The black and white arrowheads point to the expression domain. hpf, hours postfertilization; fb, forebrain; hb, hindbrain; pf, pectoral fin; h, heart; rcf, retina choroid fissure |
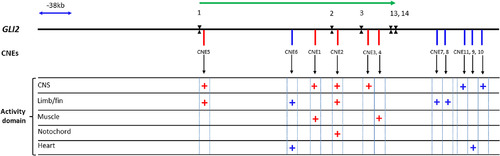
Schematic overview of the inventory of cis-regulatory elements regulating GLI2 expression in various developmental domains. Schematic view of human GLI2, encompassing 100 kb flanking region from both directions showing exons in the black collate and conserved CNEs in red and blue lines. CNEs represented in red lines were reported previously28 whereas, those presented as blue vertical lines are detected in the present study. The black arrow underneath the CNE elements points to their activity in respective tissue domain. CNEs drove the reporter gene expression in various domains (including heart, fin, and CNS) are marked as plus sign (+). Genic architecture is drawn according to scale. Green arrowhead depicts the direction of GLI2 transcription. Ex, exon; kb, kilobase |