
|
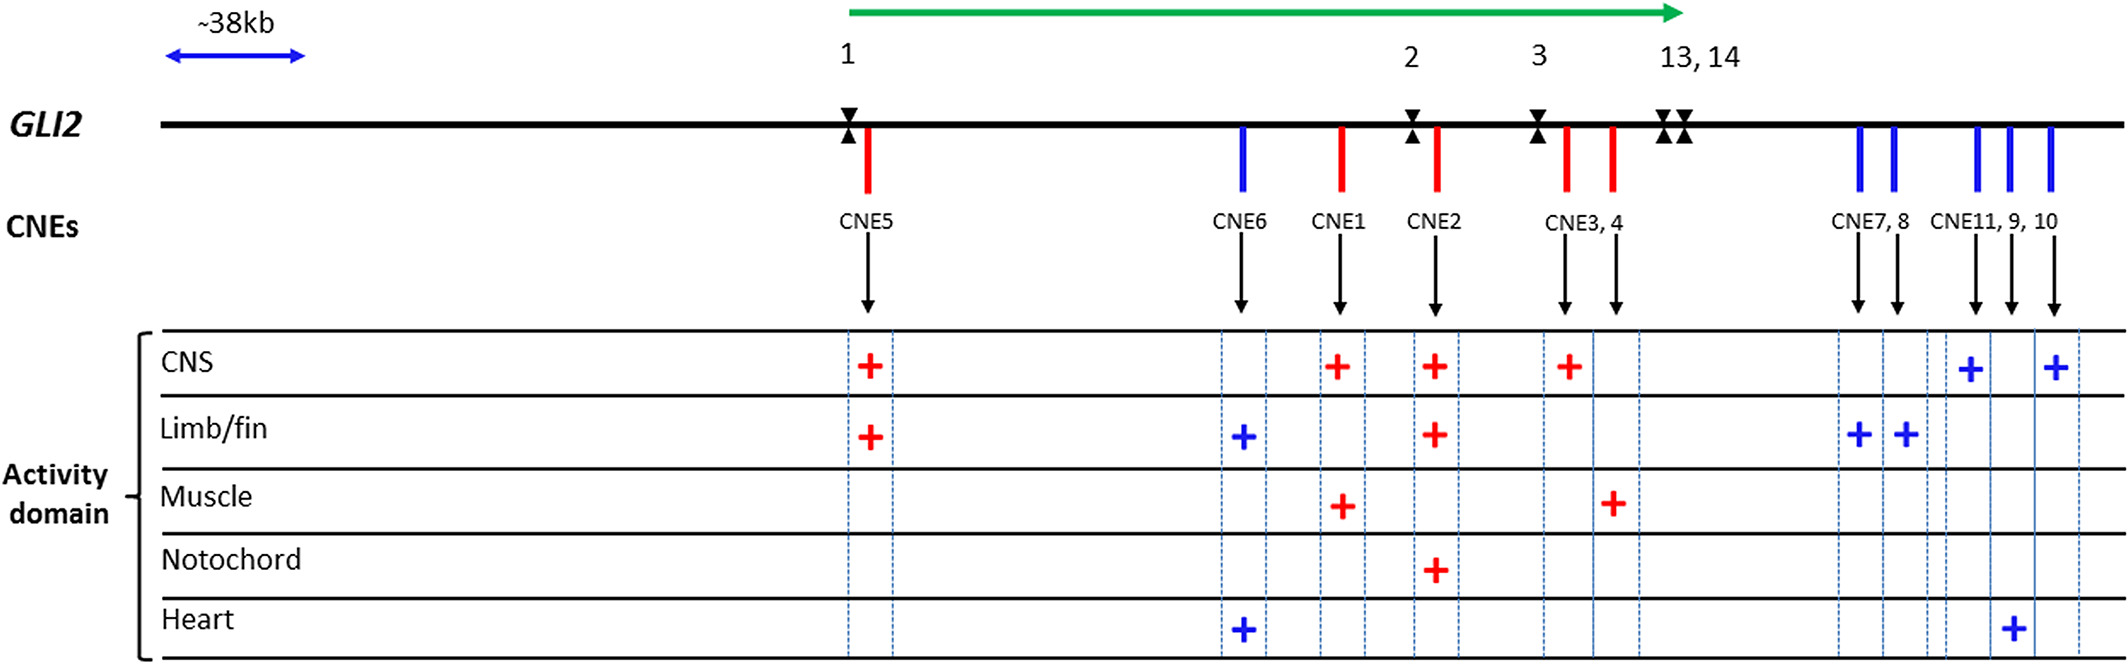
Fig. 7 Schematic overview of the inventory of cis-regulatory elements regulating GLI2 expression in various developmental domains. Schematic view of human GLI2, encompassing 100 kb flanking region from both directions showing exons in the black collate and conserved CNEs in red and blue lines. CNEs represented in red lines were reported previously28 whereas, those presented as blue vertical lines are detected in the present study. The black arrow underneath the CNE elements points to their activity in respective tissue domain. CNEs drove the reporter gene expression in various domains (including heart, fin, and CNS) are marked as plus sign (+). Genic architecture is drawn according to scale. Green arrowhead depicts the direction of GLI2 transcription. Ex, exon; kb, kilobase