
|
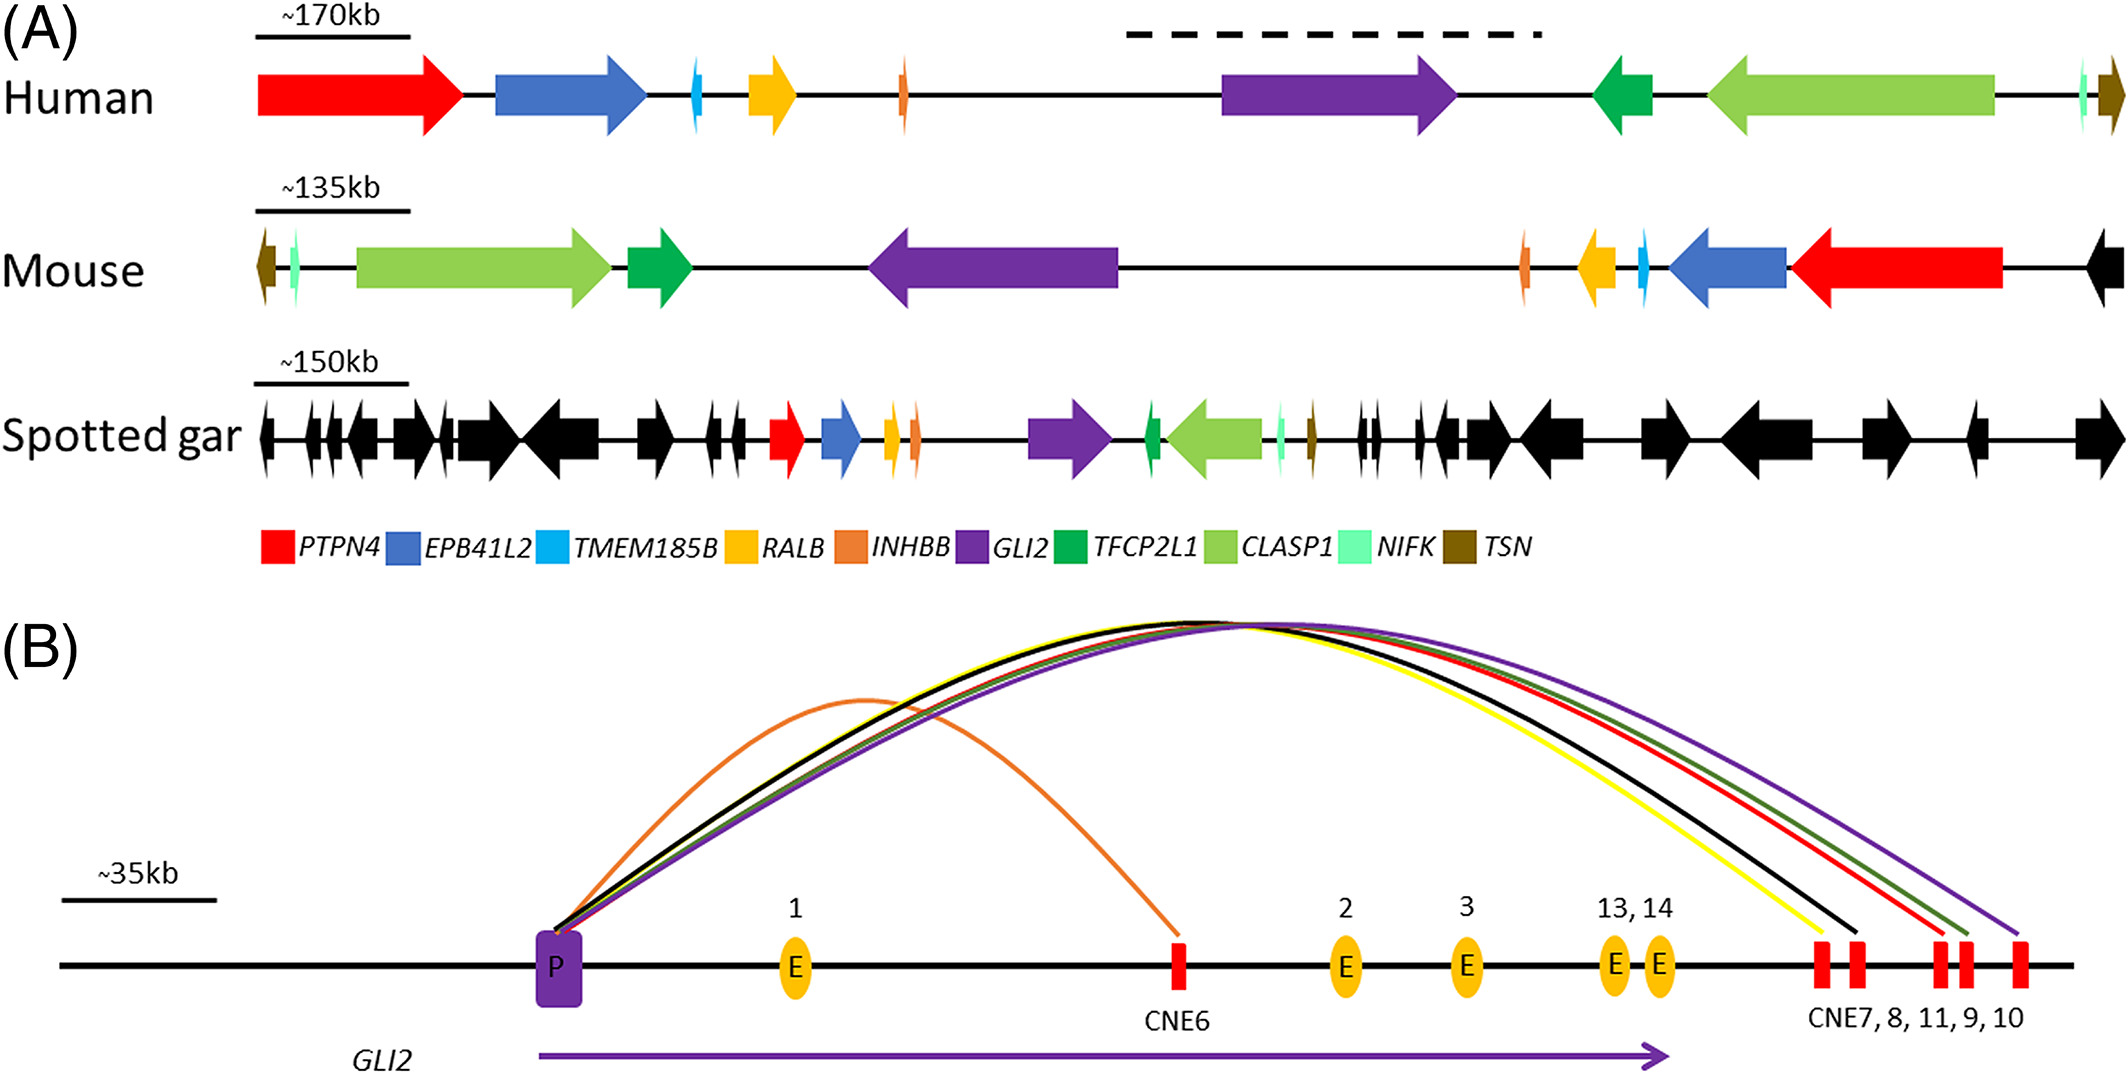
Fig. 2 Syntenic mapping of GLI2 locus and GLI2 promoter physical interaction with intragenic and intergenic CNEs. Panel A: Comparative syntenic investigation of human-mouse and spotted gar Gli2 containing orthologous loci reveals the deep conservation of this genomic block down to fish. This 2 MB orthologous block consists of conserved genes GLI2, TFCP2L1, CLASP1, NIFK, TSN, INHBB, RALB, TMEM185B, EPB41L5, PTTPN4. The endogenous expression pattern analysis and orthology mapping failed to exclusively associate CNEs identified in the present study with a single gene body. Conserved genes are color coded (other than black), whereas non-conserved genes are depicted in black. The genic architecture of loci is drawn according to the approximate scale (blackline). The black dashed line on top of GLI2 locus showing the region presented in Panel B. Panel B: The virtual 4C data obtained from the 3D genome browser shows the physical interaction of intragenic and intergenic CNEs with GLI2 promoter. The blue rectangle depicts GLI2 promoter while CNEs are depicted as red rectangles. The orange ovals are GLI2 exons. The parabolas direct the CNEs interaction with promoter. The purple arrowhead underneath depicts the direction of GLI2 transcription