FIGURE SUMMARY
Title

Sanguisorba officinalis L. Suppresses Triple-Negative Breast Cancer Metastasis by Inhibiting Late-Phase Autophagy via Hif-1α/Caveolin-1 Signaling

Authors
Wang, N., Muhetaer, G., Zhang, X., Yang, B., Wang, C., Zhang, Y., Wang, X., Zhang, J., Wang, S., Zheng, Y., Zhang, F., Wang, Z.
Source
Full text @ Front Pharmacol

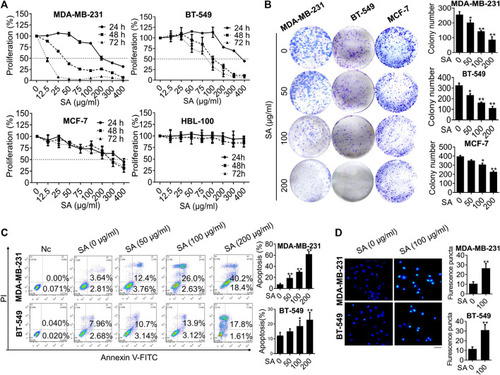
SA exerts anti-proliferation and apoptosis-promoting effects in breast cancer cells. (A) Proliferation of the indicated cells treated with either certain concentrations (0–400 μg/ml) of SA for 48 h or certain time intervals (0, 24, and 48 h) of SA by CCK8 assays. (B) The influence of SA (0–200 μg/ml) on colony formation of MDA-MB-231, BT-549, and MCF-7 cells. (C) The apoptotic populations after a 48-h treatment of SA (0–200 μg/ml) in MDA-MB-231 and BT-549 cells. (D) The fluorescence photographs of SA-treated cells stained with Hoechst 33,258 dye (100 μg/ml). Scale bar: 50 μM. All values represent the mean ± SD (n = 3, *p < 0.05, **p < 0.01).

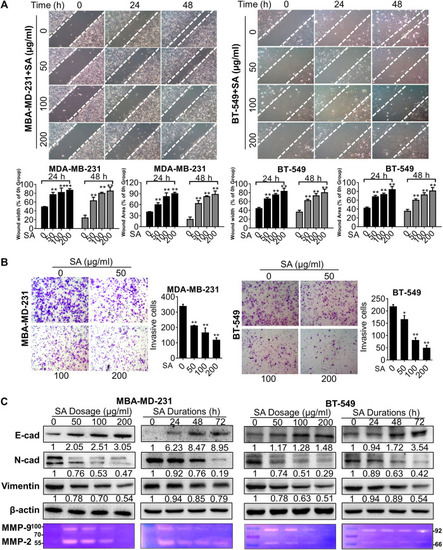
SA suppresses migration and invasion in metastatic cells. (A) Representative phase-contrast images for wound healing assays. Left: quantification of migration distances; right: quantification of migration healing areas. (B) Representative images (left) and quantification (right) of decreased cell number in transwell chambers with or without SA (0–200 μg/ml). (C) Western blotting analysis of E-cad, N-cad and vimentin as well as gelatin zymography detection of MMP-2, and MMP-9 after the indicated SA treatment. All values represent the mean ± SD (n = 3, *p < 0.05, **p < 0.01).

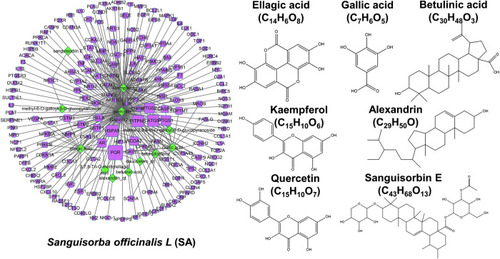
Network pharmacology analysis of SA. Left: an established ingredient-target network of SA. Ingredients and targets were respectively visualized by green-diamond and purple-square nodes, whose sizes were depending on degree values. Right: The structures of representative compounds of SA.

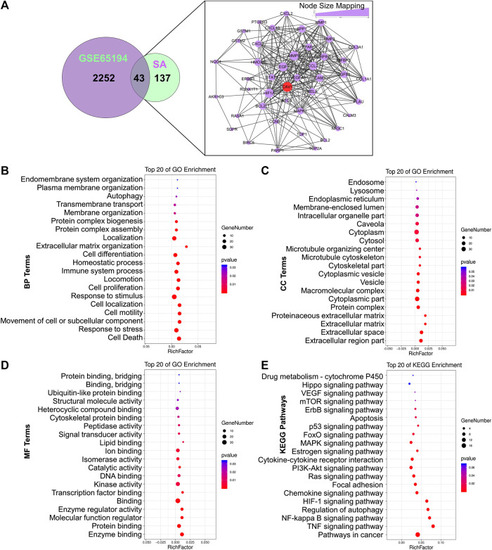
Establishment of an ingredient-target-breast cancer network of SA. (A) Among the overlapping DEGs between SA and GSE65194 datasets, CAV-1 was recognized as the hub target due to its largest degree in the node-size mapping. Bubble diagram showed the GO terms of (B) biological processes (BPs), (C) cellular components (CCs), as well as (D) molecular functions (MFs), and (E) KEGG terms for enrichment analysis.

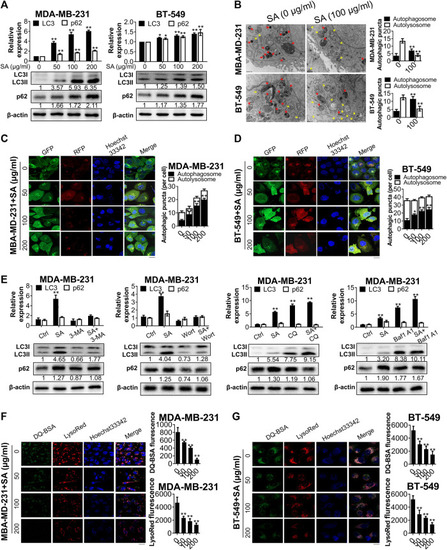
SA inhibits autophagic flux in metastatic cells. (A) LC3-II and p62 expressions in MDA-MB-231 and BT-549 cells in exposure to different concentrations (0–200 μg/ml) of SA for 48 h. (B) Representative electron micrographs of the cells with SA (100 μg/ml) for 48 h. The yellow arrows represented autophagosomes, whereas the red arrows represented autolysosomes. (C,D) Fluorescence photographs of MDA-MB-231 and BT-549 cells transfected with an LC3-GFP-mRFP reporter after SA treatment (0–200 μg/ml) for 48 h. Scale bar: 10 μM. (E) Representative bands of LC3-II and p62 in SA-treated MDA-MB-231 cells in addition to 3-MA (10 mM), wortmannin (Wort, 2 μM), CQ (30 μM), or bafilomycin A1 (Baf1, 100 nM) for 48 h. (F,G) The fluorescence photographs of SA-treated cells labeled with LysoRed or DQ-BSA. Scale bar: 20 μM. All values represent the mean ± SD (n = 3, *p < 0.05, **p < 0.01).

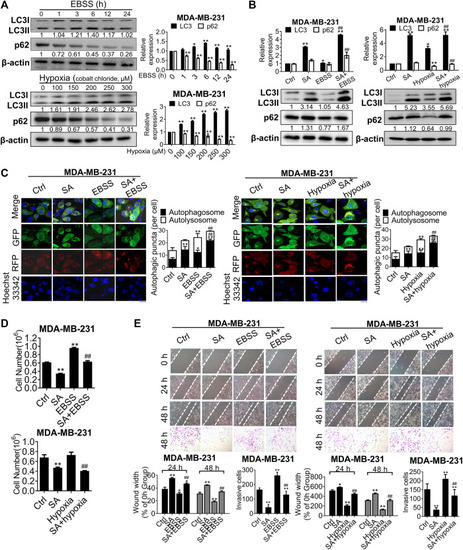
SA suppresses autophagy-mediated metastatic processes during starvation or hypoxia. (A) LC3 and p62 expressions in cells co-treated with EBSS or cobalt chloride by western blotting detection. EBSS treatment for 6 h or the hypoxic treatment with cobalt chloride at 200 μM were selected for the following experiments. All values represent the mean ± SD (n = 3, *p < 0.05, **p < 0.01). (B) LC3 and p62 levels in MDA-MB-231 cells with SA (100 μg/ml) alone or combination with either a 6-h treatment of EBSS (Left) or cobalt chloride at 200 μM (Right). Values represent the mean ± SD (n = 3, *p < 0.05, **p < 0.01 vs. Ctrl, ##p < 0.01 vs. EBSS or hypoxia). (C) Representative images of autophagic flux in MDA-MB-231 cells with or without SA (100 μg/ml) during starvation or hypoxic conditions by a LC3-GFP-mRFP reporter. Scale bar: 10 μM. Values represent the mean ± SD (n = 3, *p < 0.05, **p < 0.01 vs. Ctrl, ##p < 0.01 vs. EBSS or hypoxia). (D) Cell counting assays and (E) wound healing assays as well as transwell invasion assays reflected the influences of SA on cell growth or invasiveness under starvation (EBSS) or hypoxia (cobalt chloride). Values represent the mean ± SD (n = 3, *p < 0.05, **p < 0.01 vs. Ctrl, ##p < 0.01 vs. EBSS or hypoxia).

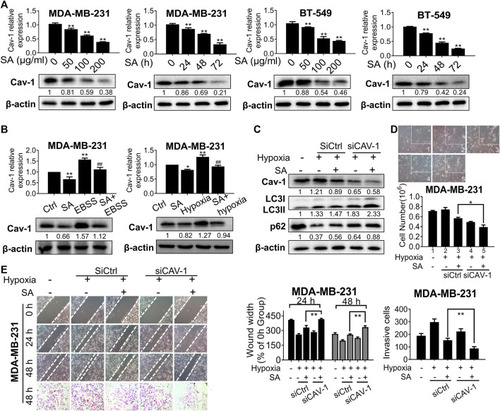
SA inhibits Cav-1 expression and blocks late-phase autophagy and subsequent metastatic processes. (A) The expression levels of Cav-1 in MDA-MB-231 and BT-549 cells with different concentrations (0–200 μg/ml) or time intervals (24–72 h) of SA. All values represent the mean ± SD (n = 3, *p < 0.05, **p < 0.01). (B) The expression levels of Cav-1 in cells treated with SA (100 μg/ml) during starvation or hypoxic conditions. Values represent the mean ± SD (n = 3, *p < 0.05, **p < 0.01 vs. Ctrl, ##p < 0.01 vs. EBSS or hypoxia). (C) Cav-1, LC3-II, and p62 protein levels in MDA-MB-231 cells transfected with siCAV-1 with or without SA (100 μg/ml) during hypoxia for 48 h. Values represent the mean ± SD (n = 3, *p < 0.01 SA + empty vector group during hypoxia vs. SA + siCAV-1 group during hypoxia). (D) Cell counting assays and (E) wound healing assays as well as transwell invasion assays showed that SA suppressed breast-cancer growth and metastasis in a Cav-1-dependent manner under hypoxic stress. Values represent the mean ± SD (n = 3, *p < 0.05, *p < 0.01 SA + empty vector group during hypoxia vs. SA + CAV-1 group during hypoxia).

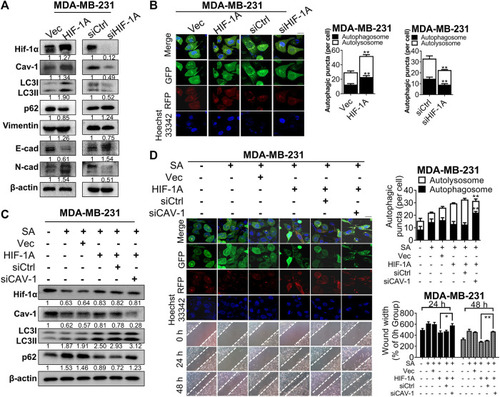
SA exerts anti-metastatic effects partially via Cav-1/Hif-1α signaling. (A) The levels of Hif-1α, Cav-1, LC3, p62, vimentin, E-cad, and N-cad in MDA-MB-231 cells before or after the transfection of HIF-1A plasmid or siHIF-1A. (B) Representative fluorescence photographs showing autophagic activities of MDA-MB-231 cells transfected with or without HIF-1A plasmid or siHIF1-A. Scale bar: 10 μM. All values represent the mean ± SD (n = 3, **p < 0.01). (C) The levels of Hif-1α, Cav-1, LC3, and p62 in SA-treated MDA-MB-231 cells transfected with HIF-1A plasmid with or without siCAV-1 during hypoxia were measured via western blotting analysis. (D) Autophagic flux was determined by a LC3-GFP-mRFP reporter and migration distances were detected by wound healing assays in SA-treated MDA-MB-231 cells after the indicated genetic modifications. Scale bar: 10 μM. Values represent the mean ± SD (n = 3, **p < 0.01 SA + HIF-1A group vs. SA + HIF-1A group + siCAV-1).

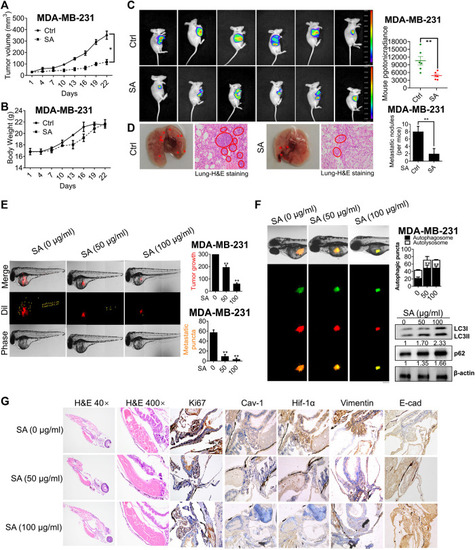
SA suppresses breast cancer growth and metastasis in vivo and ex vivo. (A) Tumor volume, (B) body weight, (C) tumor-bioluminescence imaging, and (D) pulmonary metastatic nodules in nude mice bearing MDA-MB-231 cells with or without SA administration (n = 6, *p < 0.05, **p < 0.01). (E) The tumor foci in the control and SA-treated zebrafishes. Red fluorescence represented Dil-stained MDA-MB-231 cells, and yellow arrow labeled the position of disseminated tumor. (F) The effects of SA on autophagic flux was measured by LC3-GFP-mRFP reporter and the autophagy-associated indexes, LC3-II and p62, by western blotting analysis. Scale bar: 50 μM. (G) H&E staining and IHC detection of Ki-67, Cav-1, Hif-1α, vimentin, and E-cad expressions for each indicated group (n = 3, *p < 0.05, **p < 0.01).

Acknowledgments
This image is the copyrighted work of the attributed author or publisher, and ZFIN has permission only to display this image to its users. Additional permissions should be obtained from the applicable author or publisher of the image. Full text @ Front Pharmacol