FIGURE

FIGURE 6

ID
ZDB-FIG-210103-6
Publication
Wang et al., 2020 - Sanguisorba officinalis L. Suppresses Triple-Negative Breast Cancer Metastasis by Inhibiting Late-Phase Autophagy via Hif-1α/Caveolin-1 Signaling
Other Figures
All Figure Page
Back to All Figure Page
FIGURE 6

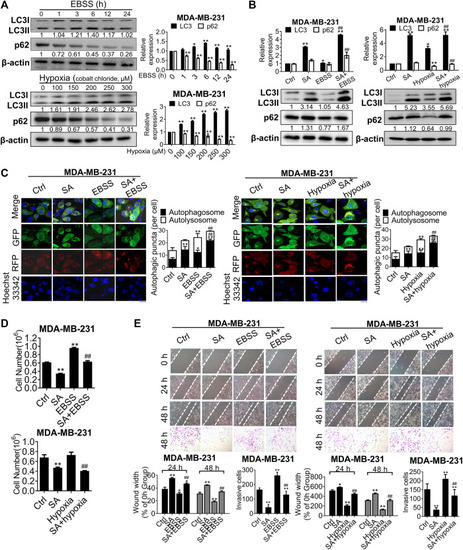
SA suppresses autophagy-mediated metastatic processes during starvation or hypoxia. (A) LC3 and p62 expressions in cells co-treated with EBSS or cobalt chloride by western blotting detection. EBSS treatment for 6 h or the hypoxic treatment with cobalt chloride at 200 μM were selected for the following experiments. All values represent the mean ± SD (n = 3, *p < 0.05, **p < 0.01). (B) LC3 and p62 levels in MDA-MB-231 cells with SA (100 μg/ml) alone or combination with either a 6-h treatment of EBSS (Left) or cobalt chloride at 200 μM (Right). Values represent the mean ± SD (n = 3, *p < 0.05, **p < 0.01 vs. Ctrl, ##p < 0.01 vs. EBSS or hypoxia). (C) Representative images of autophagic flux in MDA-MB-231 cells with or without SA (100 μg/ml) during starvation or hypoxic conditions by a LC3-GFP-mRFP reporter. Scale bar: 10 μM. Values represent the mean ± SD (n = 3, *p < 0.05, **p < 0.01 vs. Ctrl, ##p < 0.01 vs. EBSS or hypoxia). (D) Cell counting assays and (E) wound healing assays as well as transwell invasion assays reflected the influences of SA on cell growth or invasiveness under starvation (EBSS) or hypoxia (cobalt chloride). Values represent the mean ± SD (n = 3, *p < 0.05, **p < 0.01 vs. Ctrl, ##p < 0.01 vs. EBSS or hypoxia).

Expression Data

Expression Detail
Antibody Labeling
Phenotype Data

Phenotype Detail
Acknowledgments
This image is the copyrighted work of the attributed author or publisher, and ZFIN has permission only to display this image to its users. Additional permissions should be obtained from the applicable author or publisher of the image. Full text @ Front Pharmacol