
- Title
-
PTPN21/Pez Is a Novel and Evolutionarily Conserved Key Regulator of Inflammation In Vivo
- Authors
- Campbell, J.S., Davidson, A.J., Todd, H., Rodrigues, F.S.L.M., Elliot, A.M., Early, J.J., Lyons, D.A., Feng, Y., Wood, W.
- Source
- Full text @ Curr. Biol.

Pez Is Required for Macrophage Migration to Epithelial Wounds and Functions within the H2O2-Src42A-Draper Signaling Pathway (A) Pez locus highlighting mutant alleles. Approximate CB insertion (6.056 kb) site is indicated. (B) Live imaging of inflammation following laser ablation reveals reduced macrophage recruitment in (C) Quantification reveals a significant decrease in macrophage numbers at wounds in the two (D and E) Cell tracking reveals (D) macrophage speed post-wounding is unaffected in (F) Heterozygote ( (G) Significantly reduced macrophage wound recruitment in transheterozygotes embryos versus All error bars are mean ± SD. NS, not significant; ∗p < 0.05, ∗∗p < 0.01, ∗∗∗p < 0.005, and ∗∗∗∗p < 0.001. All scale bars represent 20 μm. See also |

The Role of Pez in Macrophage Wound Recruitment Is Cell Autonomous and Dependent upon the FERM Domain (A) Macrophage-specific expression of Pez-RNAi (TRiP constructs) impairs inflammatory recruitment to wounds (images 1 h post-wounding). Scale bars represent 10 μm. Wound margin is denoted by dashed red line. (B) Pez-RNAi significantly reduces macrophage recruitment to wounds compared to control (n ≥ 21 wounded embryos/genotype; Kruskal-Wallis with Dunn’s multiple comparisons). (C) Pez-sfGFP expression in macrophages (outlined in red) co-expressing either control RNAi or either Pez-RNAi. Scale bars represent 10 μm. (D) Both RNAi lines significantly reduce macrophage Pez-sfGFP intensity levels (n = 18 cells from 6 embryos/genotype; Kruskal-Wallis with Dunn’s multiple comparisons). (E) UAS-Pez expression constructs. FERM domain and PTP domains noted and deletions depicted. For phosphatase dead construct ( (F) Images of wounded (G) Macrophage-specific expression of (H) Quantification of meandering index reveals specific expression of Pez rescues the inflammatory chemotaxis of All error bars are mean ± SD. ∗p < 0.05, ∗∗p < 0.01, ∗∗∗p < 0.005, and ∗∗∗∗p < 0.001. See also |
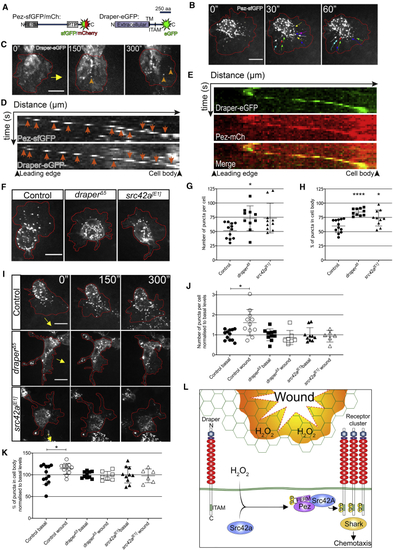
Dynamic Pez Puncta Are Stimulated upon Wounding in a Draper-Dependent Manner (A) Diagrams of fluorescently tagged Pez and Draper constructs. For Pez, the FERM and PTP domains are shown. For Draper, the N-terminal extracellular domain is noted, along with the transmembrane domain (TM) and immunoreceptor tyrosine activation motif (ITAM). (B) Pez forms puncta within the cell body and lamellipod. Dynamic lamellipodial puncta flow inward from the cell periphery (denoted by red line). Colored arrows show puncta tracking over 1 min. (C) Dynamic Draper-EGFP puncta (orange arrowheads) induced post-wounding. Red line donates cell periphery; yellow arrow indicates direction of wound. (D) Kymographs of individual Pez-sfGFP and Draper-EGFP puncta (orange arrows) following wounding demonstrate similar dynamics over time. (E) Kymograph of Draper-EGFP punctum reveals colocalization with Pez-mCh following wounding. For all kymographs, the x axes represent distance starting at lamellipod leading edge (174 nm/pixel; 17.4 μm total). The y axes represent time (10 s/pixel; 2.5 min total). (F) Lamellipodial Pez-sfGFP puncta are suppressed in (G and H) Puncta number (G) and distribution (cell body versus lamellipod; H) significantly altered in mutants (n ≥ 10 cells from ≥5 embryos/genotype; Kruskal-Wallis with Dunn’s multiple comparisons and one-way ANOVA with Tukey’s comparisons, respectively). (I) Images of control, (J and K) Analysis of Pez puncta 5 min post-wounding reveals (J) a wound-induced significant increase in puncta number that is dependent on both Draper and Src42A (n ≥ 6 cells from ≥5 embryos/genotype for each condition; Kruskal-Wallis with Dunn’s multiple comparisons) and (K) a wound-induced significant increase in the proportion of puncta residing within the cell body of control cells that is absent in (L) Proposed role of Pez in wound-induced Draper clustering. Under basal conditions, Draper’s ITAM domain remains in an inactive state. Following H2O2-mediated Src42A activation, phosphorylated Pez is recruited to Draper clusters via its FERM-domain-mediated interaction with Src42a. Acting as an adaptor, Pez coordinates inflammatory Draper signaling via effectors such as Shark, leading to efficient macrophage chemotaxis. See also |
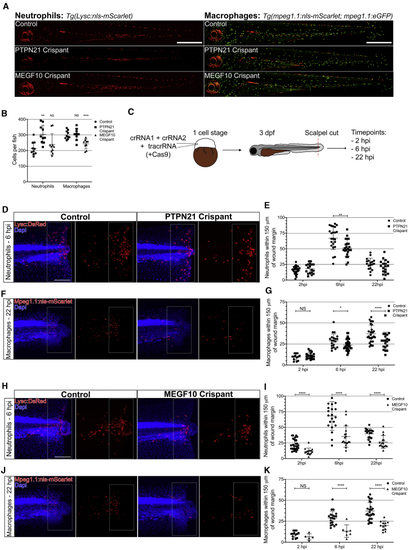
The Orthologs of Pez (PTPN21) and Draper (MEGF10) Are Required for Leukocyte Recruitment to Wounds in Zebrafish Larvae (A) Representative images of entire control, PTPN21 crispant, and MEGF10 crispant zebrafish 3 dpf larvae expressing either (B) Quantification of leukocyte numbers revealed an increase in neutrophils in PTPN21 crispants (n = 10 larvae/genotype; Kruskal-Wallis with Dunn’s multiple comparisons) and a decrease in macrophage in MEGF10 crispants (n ≥ 7 larvae/genotype; one-way ANOVA with Dunnett’s multiple comparisons). (C) For wound studies, zebrafish embryos (one cell stage) were injected with 2 CRISPR guide RNAs (crRNAs) alongside tracrRNA and raised to 3 dpf. Following tailfin transection, fish were stained at 2, 6, and 22 h post-injury (hpi). (D) Images of wounded control larvae and PTPN21 crispants at 2, 6, and 22 hpi time points. (E) Significantly reduced neutrophils recruited to the wound at 6 hpi in PTPN21 crispant larvae compared to control (n ≥ 18 wounded larvae/genotype for each time point; multiple t test). (F) Images of wounded control larvae and PTPN21 crispants at 2, 6, and 22 hpi time points. (G) Significantly reduced macrophages recruited to the wound at 6 hpi and 22 hpi in PTPN21 crispants (n ≥ 17 wounded larvae/genotype for each time point; multiple t test). (H) Images of wounded control larvae and MEGF10 crispants at 2, 6, and 22 hpi. (I) Significantly reduced neutrophils recruited to the wound at all time points in MEGF10 crispant compared to the control (n ≥ 15 wounded larvae/genotype for each time point; multiple t test). (J) Images of wounded control larvae and MEGF10 crispants at 2, 6, and 22 hpi time points. (K) Significantly reduced macrophages recruited to the wound at 6 hpi and 22 hpi in PTPN21 crispant (n ≥ 13 wounded larvae/genotype for each time point; multiple t test). All error bars are mean ± SD. ∗p < 0.05, ∗∗p < 0.01, and ∗∗∗∗p < 0.001. All scale bars represent 100 μm. See also |