
|
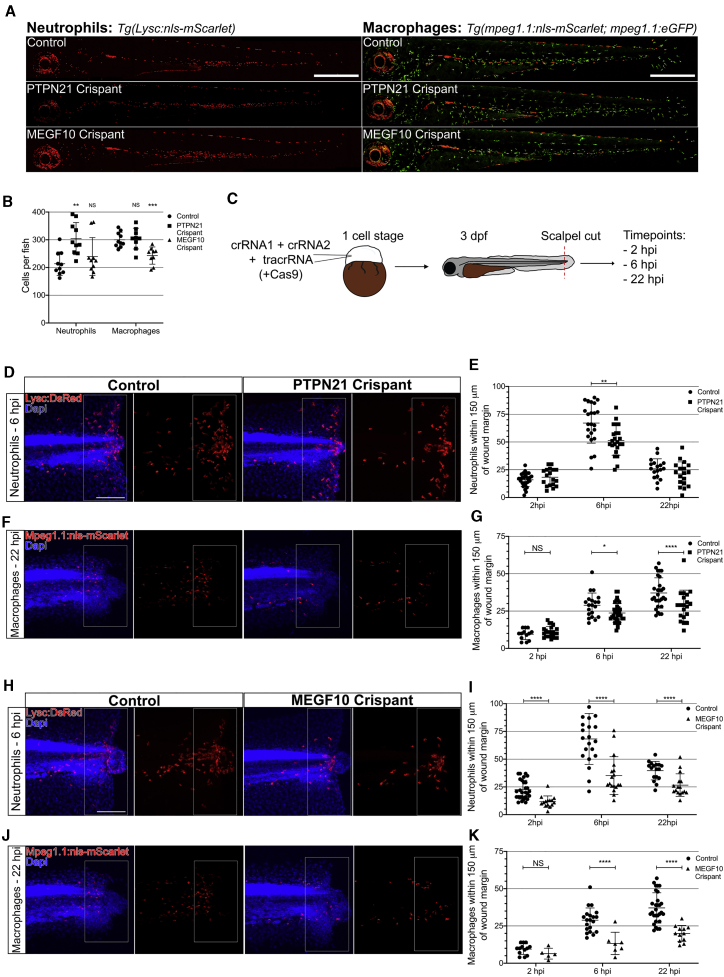
Figure 4
The Orthologs of Pez (PTPN21) and Draper (MEGF10) Are Required for Leukocyte Recruitment to Wounds in Zebrafish Larvae
(A) Representative images of entire control, PTPN21 crispant, and MEGF10 crispant zebrafish 3 dpf larvae expressing either
(B) Quantification of leukocyte numbers revealed an increase in neutrophils in PTPN21 crispants (n = 10 larvae/genotype; Kruskal-Wallis with Dunn’s multiple comparisons) and a decrease in macrophage in MEGF10 crispants (n ≥ 7 larvae/genotype; one-way ANOVA with Dunnett’s multiple comparisons).
(C) For wound studies, zebrafish embryos (one cell stage) were injected with 2 CRISPR guide RNAs (crRNAs) alongside tracrRNA and raised to 3 dpf. Following tailfin transection, fish were stained at 2, 6, and 22 h post-injury (hpi).
(D) Images of wounded control larvae and PTPN21 crispants at 2, 6, and 22 hpi time points.
(E) Significantly reduced neutrophils recruited to the wound at 6 hpi in PTPN21 crispant larvae compared to control (n ≥ 18 wounded larvae/genotype for each time point; multiple t test).
(F) Images of wounded control larvae and PTPN21 crispants at 2, 6, and 22 hpi time points.
(G) Significantly reduced macrophages recruited to the wound at 6 hpi and 22 hpi in PTPN21 crispants (n ≥ 17 wounded larvae/genotype for each time point; multiple t test).
(H) Images of wounded control larvae and MEGF10 crispants at 2, 6, and 22 hpi.
(I) Significantly reduced neutrophils recruited to the wound at all time points in MEGF10 crispant compared to the control (n ≥ 15 wounded larvae/genotype for each time point; multiple t test).
(J) Images of wounded control larvae and MEGF10 crispants at 2, 6, and 22 hpi time points.
(K) Significantly reduced macrophages recruited to the wound at 6 hpi and 22 hpi in PTPN21 crispant (n ≥ 13 wounded larvae/genotype for each time point; multiple t test).
All error bars are mean ± SD. ∗p < 0.05, ∗∗p < 0.01, and ∗∗∗∗p < 0.001. All scale bars represent 100 μm. See also