IMAGE

Figure 1

ID
ZDB-IMAGE-210307-74
Source
Figures for Campbell et al., 2020
Image
Figure Caption

Figure 1

Pez Is Required for Macrophage Migration to Epithelial Wounds and Functions within the H2O2-Src42A-Draper Signaling Pathway

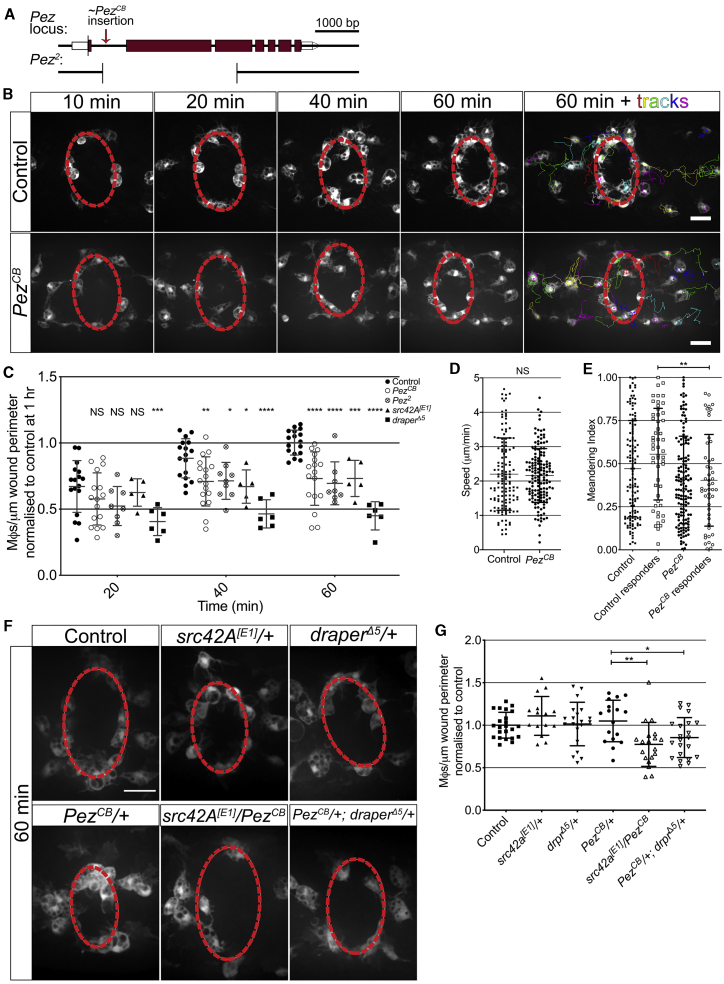
(A) Pez locus highlighting mutant alleles. Approximate CB insertion (6.056 kb) site is indicated. Pez2 deletion is marked below, adapted from Poernbacher et al.17

(B) Live imaging of inflammation following laser ablation reveals reduced macrophage recruitment in PezCB mutants. Wound margin is denoted by dashed red line. Cell tracks are shown at 1 h.

(C) Quantification reveals a significant decrease in macrophage numbers at wounds in the two Pez mutant lines at 40 and 60 min post-injury (n ≥ 10 wounded embryos/genotype; multiple t tests with Holm-Sidak multiple comparisons).

(D and E) Cell tracking reveals (D) macrophage speed post-wounding is unaffected in PezCB mutants (n ≥ 130 cells from ≥5 embryos/genotype; Mann-Whitney U test), and (E) meandering index is significantly reduced in responding (cells that reach the wound site at any point within 2 h) PezCB macrophages (n = 53 responders from ≥5 embryos/genotype; Mann-Whitney U test).

(F) Heterozygote (src42A[E1]/+, draperΔ5/+, and PezCB/+) and transheterozygote (src42A[E1]/PezCB and PezCB/+; draperΔ5/+) mutant embryos at 60 min post-wounding. Wound margin is denoted by dashed red line.

(G) Significantly reduced macrophage wound recruitment in transheterozygotes embryos versus PezCB/+ (n ≥ 15 wounded embryos/genotype; one-way ANOVA with multiple comparisons).

All error bars are mean ± SD. NS, not significant; p < 0.05, ∗∗p < 0.01, ∗∗∗p < 0.005, and ∗∗∗∗p < 0.001. All scale bars represent 20 μm. See also Figure S2 and Videos S1, S2, and S3.

Acknowledgments
This image is the copyrighted work of the attributed author or publisher, and ZFIN has permission only to display this image to its users. Additional permissions should be obtained from the applicable author or publisher of the image. Full text @ Curr. Biol.