
- Title
-
The major vault protein is dispensable for zebrafish organ regeneration
- Authors
- Zhang, X., Yang, Y., Bu, X., Wei, Y., Lou, X.
- Source
- Full text @ Heliyon

ZFIN is incorporating published figure images and captions as part of an ongoing project. Figures from some publications have not yet been curated, or are not available for display because of copyright restrictions. |

Expression analysis of EXPRESSION / LABELING:
|
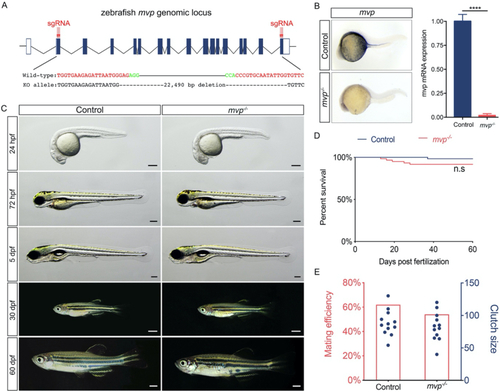
Generation of PHENOTYPE:
|
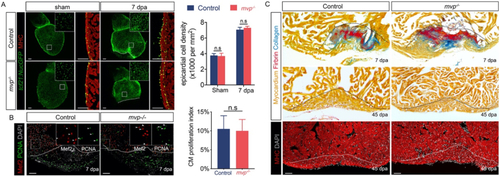
Heart regeneration in PHENOTYPE:
|
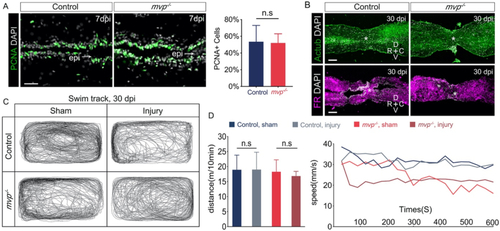
Spinal cord regeneration in PHENOTYPE:
|
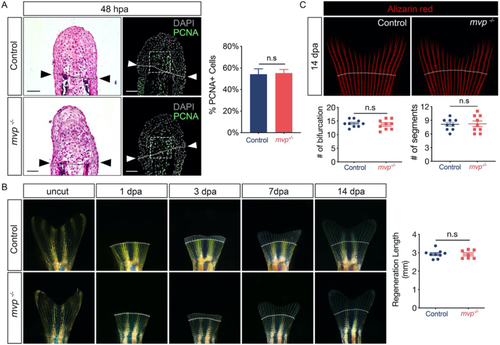
Fin regeneration in PHENOTYPE:
|
The effects of loss of PHENOTYPE:
|