IMAGE

Figure 3

ID
ZDB-IMAGE-201121-144
Source
Figures for Zhang et al., 2020
Image
Figure Caption

Figure 3

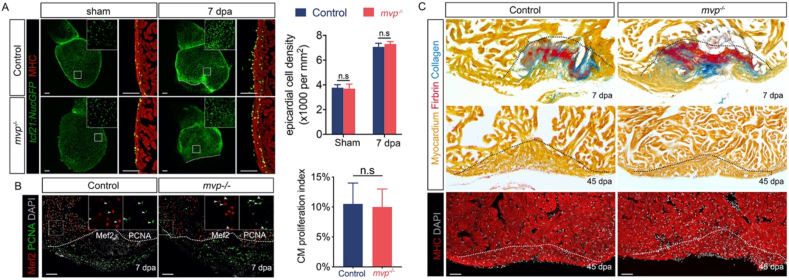
Heart regeneration in mvp KO fish. (A) Visualization of epicardial cells in control and mvp−/− fish. Epicardial cells proliferate by 7 dpi and are incorporated into the regenerating myocardial wall. Inset shows enlarged view of boxed area. Bar graph showing the density of epicardial cell at surface of hearts from control and mvp−/− fish. Data are mean ± SEM. For each group, eight samples were assessed. n.s, not significant. (B) Cardiomyocyte proliferation at 7 days post-amputation (dpa) in ventricular sections from control and mvp−/− animals, assessed by Mef2 and PCNA staining. Arrowheads, the PCNA positive. Scale bar = 100 μm. Bar graph showing cardiomyocyte proliferation indices on 7 dpa in control (n = 8) and mvp−/− (n = 8) fish. Proliferation data were collected for 4–6 sections per heart and averaged to generate each data point. Data are mean ± SEM. n.s, not significant. (C) Section images of ventricles at designated time points, assessed for myocardium (MHC) recovery and scar tissue (fibrin, collagen) removal. In A, B and C, dashed line indicates approximate resection plane.

Figure Data
Acknowledgments
This image is the copyrighted work of the attributed author or publisher, and ZFIN has permission only to display this image to its users. Additional permissions should be obtained from the applicable author or publisher of the image. Full text @ Heliyon