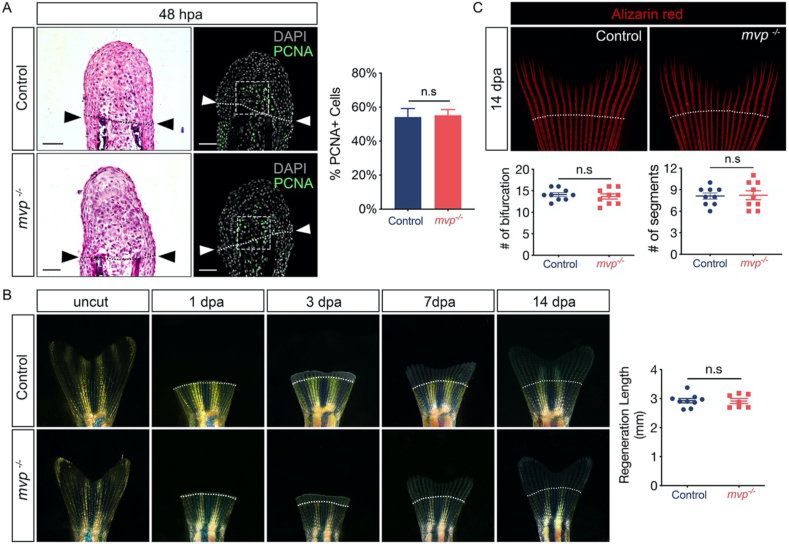
IMAGE

Figure 5

ID
ZDB-IMAGE-201121-146
Source
Figures for Zhang et al., 2020
Image
Figure Caption

Figure 5

Fin regeneration in mvp KO fish. (A) Left panel, representative hematoxylin-stained sections of caudal fin regenerates (blastemal region) at 48 h post-amputation (dpa). Arrowheads indicate the plane of amputation. Middle panel, blastemal proliferation revealed by PCNA staining. Scale bar = 50 μm. Bar graph, cell proliferation (PCNA + cells) quantified in the blastema. PCNA + cell number was averaged among all sections spanning the entire fin width, and normalized to DAPI counts in the image. n.s, not significant. (B) Live images of fin regeneration in control and mvp−/− zebrafish at designated time points. Scatter plot with mean ± SEM to show the length of regenerated tissue at 14 dpa (n = 9 for each group). (C) Representative images of bone structure (revealed by Alizarin red staining) of caudal fin in control and mvp−/− fish on 14 dpa. Left lower panel, scatter plot with mean ± SEM to show the bifurcations in regenerated tissue (n = 9 for each group). Right lower panel, scatter plot with mean ± SEM to show the segment number in regenerated tissue (n = 9 for each group). n.s, not significant. In B and C, dashed line indicates approximate resection plane.

Figure Data
Acknowledgments
This image is the copyrighted work of the attributed author or publisher, and ZFIN has permission only to display this image to its users. Additional permissions should be obtained from the applicable author or publisher of the image. Full text @ Heliyon