IMAGE

Figure 4

ID
ZDB-IMAGE-201121-145
Source
Figures for Zhang et al., 2020
Image
Figure Caption

Figure 4

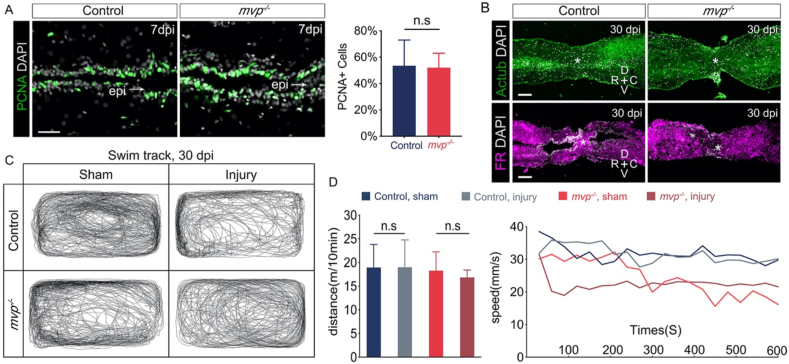
Spinal cord regeneration in mvp KO fish. (A) Proliferation of neural cells in control and mvp−/− animals on 7 day post-injury (dpi), assessed by PCNA staining. Bar graph showing percentage of proliferating neural cells in control (n = 6) and mvp−/− (n = 6) fish. epi, injury epicenter. (B) Upper panel, spinal cord structure of transected site by 30 dpi. Lower panel, retrograde tracing of axonal projections using Fluoro-Ruby (FR). Regenerating axons spanned the transection injury in both control fish (6/6) and mvp−/− fish (4/5; p < 0.05). Asterisks indicate injury epicenter. In A and B, scale bars = 100 um. (C) Representative swim tracking of individual animals. (D) Quantification of total distance (mean ± SEM, n = 6 for each group) and speed in (C). n.s, not significant.

Figure Data
Acknowledgments
This image is the copyrighted work of the attributed author or publisher, and ZFIN has permission only to display this image to its users. Additional permissions should be obtained from the applicable author or publisher of the image. Full text @ Heliyon