FIGURE SUMMARY
Title

Biliary-Atresia-Associated Mannosidase-1-Alpha-2 Gene Regulates Biliary and Ciliary Morphogenesis and Laterality

Authors
So, J., Ningappa, M., Glessner, J., Min, J., Ashokkumar, C., Ranganathan, S., Higgs, B.W., Li, D., Sun, Q., Schmitt, L., Biery, A.C., Dobrowolski, S., Trautz, C., Fuhrman, L., Schwartz, M.C., Klena, N.T., Fusco, J., Prasadan, K., Adenuga, M., Mohamed, N., Yan, Q., Chen, W., Horne, W., Dhawan, A., Sharif, K., Kelly, D., Squires, R.H., Gittes, G.K., Hakonarson, H., Morell, V., Lo, C., Subramaniam, S., Shin, D., Sindhi, R.
Source
Full text @ Front. Physiol.

ZFIN is incorporating published figure images and captions as part of an ongoing project. Figures from some publications have not yet been curated, or are not available for display because of copyright restrictions.

PHENOTYPE:
Fish:
Knockdown Reagent:
Observed In:
Stage: Day 5

ZFIN is incorporating published figure images and captions as part of an ongoing project. Figures from some publications have not yet been curated, or are not available for display because of copyright restrictions.

ZFIN is incorporating published figure images and captions as part of an ongoing project. Figures from some publications have not yet been curated, or are not available for display because of copyright restrictions.

EXPRESSION / LABELING:
Genes:
Fish:
Knockdown Reagent:
Anatomical Term:
Stage: Long-pec
PHENOTYPE:
Fish:
Knockdown Reagent:
Observed In:
Stage: Long-pec

(A) Location of MAN1A2 SNPs associated with BA. The SNPs rs7531715 and rs12131109 are associated with BA in GWAS. The SNP rs10923326 in LD (r2 = 1) with rs7531715 is significantly associated with gene expression in the liver. (B)MAN1A2 expression in diseased BA liver. Bar diagram shows expression of the exon 6 and 7 region of MAN1A2 in liver tissue from BA cases [male: female 1:5, mean (SEM) age at LTx, 1.33 (0.55) years] and healthy controls. The remaining five panels show diffuse strong (3+) granular immunostaining of MAN1A2 in the hepatocyte cytoplasm along pericanalicular membranes in normal human allografts, and liver from children with Alagille’s syndrome and types 1 and 2 progressive familial intrahepatic cholestasis (PFIC). Reduced MAN1A2 immunostaining is seen in BA liver (x200).

man1a2 knockdown results in developmental biliary defects in zebrafish. (A) Whole-mount in situ hybridization image showing man1a2 expression in developing embryos/larvae. Arrowheads point to the liver. (B) Epifluorescence images showing PED6 accumulation in the gallbladder. The arrow points to the gallbladder outlined by a dotted line; the asterisk denotes gallbladder location. Based on PED6 levels in the gallbladder, larvae were divided into three groups: normal, small/faint, and absent. Graph showing the percentage of larvae in each group. Numbers in the graph indicate the number of larvae in each group. (C) Confocal images of the liver showing the intrahepatic biliary network, as revealed by BODIPY C5 labeling (green, biliary ductal network) and Tp1:H2B-mCherry (red, BEC nuclei) expression. Based on the severity of biliary defects, larvae were divided into three groups: normal, mild, and severe. Higher magnification images of the square regions are also shown. Dotted lines outline the liver Graph shows the percentage of larvae in each group. Numbers in the graph indicate the number of larvae in each group. Arrows point to bile canaliculi; dotted lines outline the liver. (D) Confocal images of the liver showing the expression of Tp1:GFP (green) and Abcb11 (red) for biliary structure and hepatocyte bile canaliculi, respectively. Higher magnification images of the square regions are also shown. Arrows point to bile canaliculi; Dotted lines outline the liver. Numbers in the upper right corner are the fraction of larvae exhibiting the representative phenotype shown. Scale bars: 100 (A,B), 25 (C,D) μm.

man1a2 knockdown results in laterality defects in zebrafish. (A) Whole-mount in situ hybridization images showing myl7 (cardiomyocytes) and foxa3 (endodermal cells) expression at 36 hpf, which was used to determine the laterality of embryos. Three patterns of heart looping (normal, reversed, and midline) and two patterns of visceral organ position (normal and reversed) were detected and were quantified in graphs. Numbers in the graph indicate the number of larvae in each group. Arrows and arrowheads point to the liver and the dorsal pancreas, respectively; dotted lines outline the heart. Scale bars: 100 μm. (B) Confocal images of Kupffer’s vesicle showing the expression of dusp6:d2GFP (green, Kupffer’s vesicle cells) and acetylated tubulin (red, cilia). Both cilia length and number were significantly reduced in man1a2 MO-injected larvae (n = 11) compared to controls (n = 9), as shown in graphs. Scale bar: 50 μm. Error bars: ± SEM. *p < 0.001; **p < 0.005.

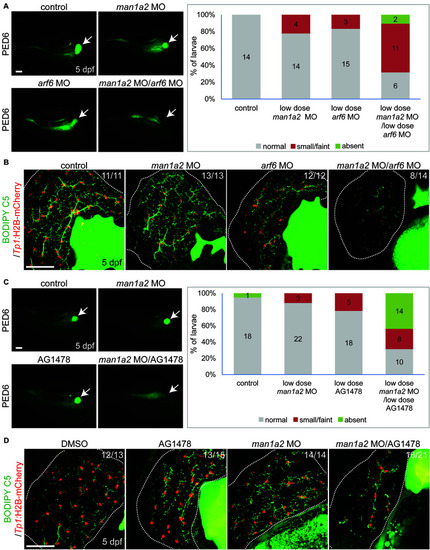
Genetic interaction among man1a2, arf6 and EGFR signaling in intrahepatic biliary network formation. (A,C) Epifluorescence images of larvae treated with PED6 and its quantification. Suboptimal doses of man1a2 (1.5 ng) and arf6 (0.5 ng) MOs were singly or in combination injected into embryos at the one-cell stage (A). Embryos were first injected with the suboptimal dose of man1a2 MO (1.5 ng) and from 60 hpf treated with a suboptimal dose of AG1478 (1 μM) (C). Arrows point to the gallbladder. Graphs show the percentage of larvae in each group. Numbers in the graph indicate the number of larvae in each group. (B,D) Confocal images of the liver showing the intrahepatic biliary network, as revealed by BODIPY-FL C5 feeding (green, biliary ductal network) and Tp1:H2B-mCherry (red, BEC nuclei) expression. Single injection of suboptimal doses of either man1a2 or arf6 MO did not impair proper intrahepatic biliary network formation, whereas their co-injection resulted in defective biliary network formation (B). The biliary network formation was not impaired in larvae only treated with AG1478, whereas it was impaired in AG1478-treated larvae with man1a2 partially knockdown (D). Numbers in the upper right corner are the fraction of larvae exhibiting the representative phenotype shown. Dotted lines outline the liver. Scale bars: 50 μm.

Man1a2 knockdown produces cilia defects in reciliating mouse respiratory epithelia. (A) Relative expression of Man1a2 in respiratory epithelia after siRNA transfection. (B) Control epithelia are well ciliated with well-coordinated ciliary beat with a full stroke (Supplementary Video 1). (C)Man1a2-siRNA-transfected respiratory epithelia exhibited very short cilia that were mostly immotile except for a few areas with slow dyskinetic ciliary beat with incomplete stroke (Supplementary Video 2). (D,E)Man1a2 knockout mice with lung involvement also exhibit liver inflammation. (D)Man1a2+/+ liver shows a portal area with indistinct bile ducts, abundant extramedullary hematopoiesis (EMH, H&E x200), and minimal ductular reaction (Epcam x200). The lung shows expanded alveoli and thin interalveolar septa. (E)Man1a2–/– liver shows expanded portal areas with inflammation including EMH (H&E) and ductular reaction (Epcam x 200). The lung shows thick septa with sparse, unexpanded alveoli. The Man1a2–/– liver transcriptome shows several dysregulated ciliary genes, including Dnah11 which causes PCD (Table 2 and Supplementary Table 10). (F,G). Dnah11–/– mice with situs inversus also exhibit biliary inflammation. (F)Dnah11+/+ mouse with normal location of heart and abdominal organs which includes two left and one right liver lobes, normal liver histology with EMH and some bile ducts in portal area. (G)Dnah11–/– null mouse shows situs inversus with cardiac heterotaxy, inverted lobation of the liver (two right lobes), right-sided stomach and more centrally located spleen. Liver shows portal congestion and bile duct proliferation. All experiments were performed in triplicate.

Man1a2 knockdown in mouse leads to decreased cilia development in lung. Confocal microscopy showed the cilia marker Arl13b (red) and nuclei (blue, Dapi) in the lung from the (A) WT (Man1a2+/+) and (B) Null Man1a2(−/−) pups. Scale bars: 50 μm. (C) The bar diagram showed the percent Arl13b+ cells (% Dapi) in lung from four WT and four Null Man1a2 pups. Error bars: ± SEM.

Acknowledgments
This image is the copyrighted work of the attributed author or publisher, and ZFIN has permission only to display this image to its users. Additional permissions should be obtained from the applicable author or publisher of the image. Full text @ Front. Physiol.