IMAGE

FIGURE 2

ID
ZDB-IMAGE-201121-68
Genes
Antibodies
Source
Figures for So et al., 2020
Image
Figure Caption

FIGURE 2

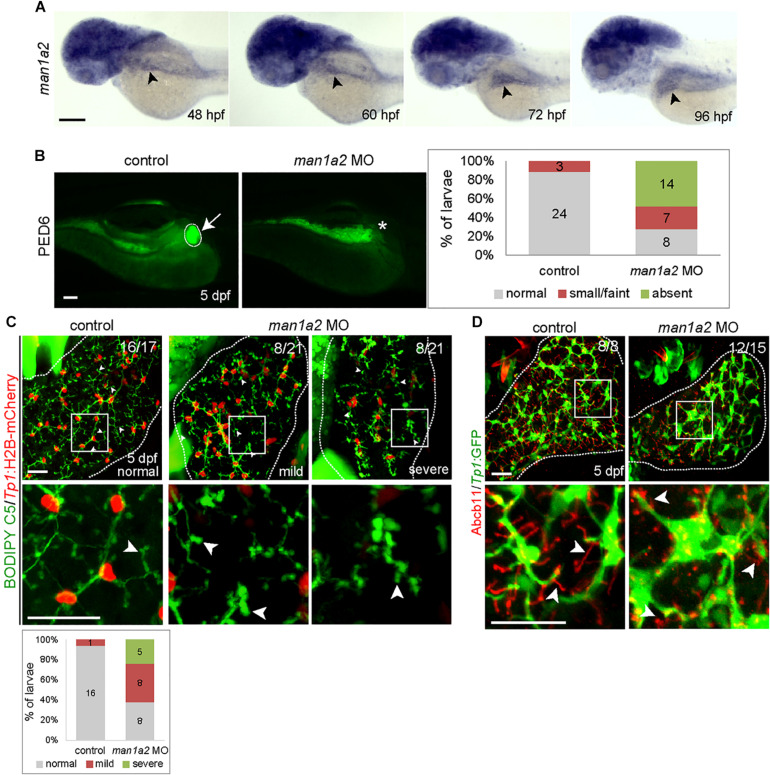
man1a2 knockdown results in developmental biliary defects in zebrafish. (A) Whole-mount in situ hybridization image showing man1a2 expression in developing embryos/larvae. Arrowheads point to the liver. (B) Epifluorescence images showing PED6 accumulation in the gallbladder. The arrow points to the gallbladder outlined by a dotted line; the asterisk denotes gallbladder location. Based on PED6 levels in the gallbladder, larvae were divided into three groups: normal, small/faint, and absent. Graph showing the percentage of larvae in each group. Numbers in the graph indicate the number of larvae in each group. (C) Confocal images of the liver showing the intrahepatic biliary network, as revealed by BODIPY C5 labeling (green, biliary ductal network) and Tp1:H2B-mCherry (red, BEC nuclei) expression. Based on the severity of biliary defects, larvae were divided into three groups: normal, mild, and severe. Higher magnification images of the square regions are also shown. Dotted lines outline the liver Graph shows the percentage of larvae in each group. Numbers in the graph indicate the number of larvae in each group. Arrows point to bile canaliculi; dotted lines outline the liver. (D) Confocal images of the liver showing the expression of Tp1:GFP (green) and Abcb11 (red) for biliary structure and hepatocyte bile canaliculi, respectively. Higher magnification images of the square regions are also shown. Arrows point to bile canaliculi; Dotted lines outline the liver. Numbers in the upper right corner are the fraction of larvae exhibiting the representative phenotype shown. Scale bars: 100 (A,B), 25 (C,D) μm.

Figure Data
Acknowledgments
This image is the copyrighted work of the attributed author or publisher, and ZFIN has permission only to display this image to its users. Additional permissions should be obtained from the applicable author or publisher of the image. Full text @ Front. Physiol.