FIGURE SUMMARY
Title

Mini-III RNase-based dual-color system for in vivo mRNA tracking

Authors
Zhang, L., Chen, L., Chen, J., Shen, W., Meng, A.
Source
Full text @ Development

Screening of inactive mR3 proteins with high dsRNA-binding affinity. (A) Scheme of ELISA to compare relative binding affinity of inactive mR3 proteins with biotin-labeled dsRNA. (B-E) Relative binding affinity of inactive mR3 proteins with actb2-dsR-P1 (B,C) or actb2-dsR-P2 (D,E) in LSB (B,D) or HSB (C,E) buffer. mR3 origins: B. subtilis (Bsu), Lactococcus lactis (Lla), S. aureus (Sau), S. epidermidis (Sep), Listeria innocua (Lin), Bacillus cereus (Bce), Bacillus licheniformis (Bli), Ruminiclostridium thermocellum (Rth), Caldicellulosiruptor kristjanssonii (Ckr), Caldanaerobacter subterraneus (Csb), Fusobacterium nucleatum (Fnu), Thermotoga maritima (Tma). GST served as the control protein. (F) Illustration of different forms of dSmR3. Full name of dSmR3nd: dead form of Sep-mR3 with nuclear localization signal in dimer. (G-J) Relative binding affinity of different dSmR3 forms: actb2-dsR-P1 (G,H) or actb2-dsR-P4 (I,J) in LSB (G,I) or HSB (H,J) buffer. mCherry served as the control protein. The concentration of monomer protein used in ELISA is 0.8 µM, dimer protein is 0.4 µM, dsRNA is 0.02 µM. Data are mean±s.d. from three repeats.

In vivo binding of dSmR3 with dsRNA and effect on target mRNA stability in the zebrafish embryo. (A) Illustration of RSGM and RM mRNA compositions. (B) Scheme of RNA immunoprecipitation: 300 pg RSGM or RM mRNA plus 350 pg as-gfp probe as well as 1 ng dSmR3nd-GFP protein were sequentially injected into one-cell-stage embryos. The dose was the amount per embryo. Approximately 2100 embryos in each group were collected at the 256-cell stage for analysis. (C) qRT-PCR analysis of Luc (left) or as-gfp (right) RNA levels using dsRNA precipitate. (D) Degradation dynamics of injected antisense probes. The actb2-as-P3 and as-gfp probes were injected, each at 100 pg per embryo, at the one-cell stage. About 40 embryos were collected at each desired stage. Total RNA was intramolecularly ligated before qRT-PCR detection. (E-G) qRT-PCR analysis of exogenous Luc (E) or endogenous acb2 (F,G) levels. One-cell embryos were injected with indicated materials and harvested at desired stages for analysis. Injection doses (per embryo): dSmR3nd-GFP protein, 1 ng; antisense RNA probes, 100 pg or 230 pg. (H) Normal development of wild-type embryos and those injected with 300 pg actb2-as-P3 alone or together with 1 ng dSmR3nd-mCherry (dSmR3nd-mC). Embryos were injected at the one-cell stage and imaged at the shield stage and 24 hpf. The ratio of embryos with representative morphology is indicated (bottom left). Data are mean±s.d. **P<0.01; ***P<0.001; ****P<0.0001 (Welch's t-test). ns, not significant. Scale bars: 100 µm.

Targeting of endogenous mRNA by fluorescein-labeled antisense probes. (A,B) Detection of fluorescent puncta by different actb2 probes. One-cell-stage embryos were injected with 300 pg of indicated fluorescein-labeled probe and fixed at the four-cell stage for confocal microscopic imaging. Representative images are animal-pole views (A) with the cell border demarcated by a white-dashed line and magnification of the boxed area in the inset. The number of puncta (B) was calculated using NIS-element software under the same setting parameters. Each dot represents a single embryo. Ne, number of observed embryos. (C) actb2 probe-induced puncta are mainly dsRNA-positive. Embryos were injected at the one-cell stage with 300 pg fluorescein-labeled sense or antisense actb2 P3 probe and fixed at the four-cell stage for immunostaining with dsRNA antibody. (D,E) eomesa (D) or ybx1 (E) antisense probe-induced puncta in wild-type or MZ mutants. Top, relative position and length of in situ hybridization probes and fluorescein-labeled antisense probes to the target mRNA. Bottom, in situ hybridization pictures and fluorescent confocal images with magnification of the boxed area in the inset. Images show animal-pole views at the four-cell stage. (F) Number of fluorescent puncta formed in wild-type (WT) or MZeomesa or MZybx1 embryos. (G-I) Intensity (G) or number (H,I) of fluorescent puncta induced by indicated actb2 antisense probes. One-cell-stage embryos were injected with 300 pg of indicated single probes or probe mix (100 pg each) and observed at the four-cell stage. In B, F-I, each dot indicated one embryo; Ne, number of observed embryos. Data are mean±s.e.m. *P<0.05; **P<0.01; ***P<0.001; ****P<0.0001 (Welch's t-test). ns, not significant. Scale bars: 100 µm (A,D,E); 10 µm (C).

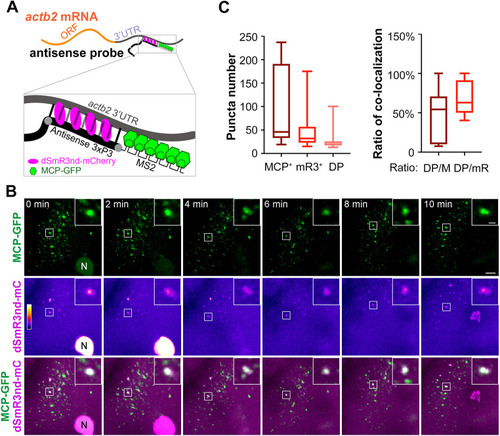
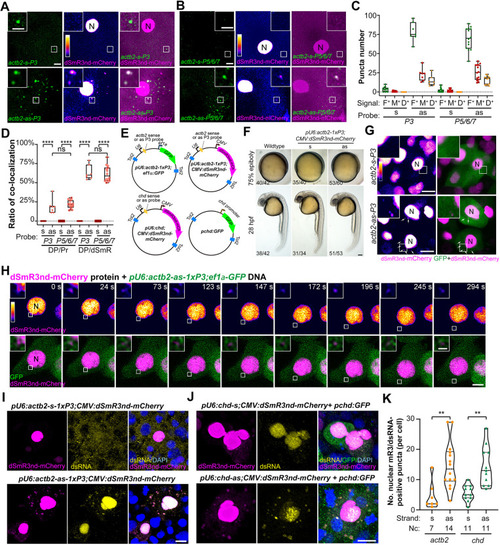
Tracking of endogenous mRNAs by dSmR3/antisense dual-color system. (A,B) In vivo tracking of maternal actb2 mRNA using dsmR3nd-mCherry together with single fluorescent actb2 probe (A) or mixed probes (B). One-cell-stage embryos were injected with 1 ng dSmR3nd-mCherry protein and 300 pg probe (for probes mix, 100 pg each) and imaged by confocal microscopy at the four-cell stage. The boxed area was enlarged in the inset. N, nucleus. (C) Total numbers of fluorescent probe puncta (F+), dSmR3 puncta (M+) and dSmR3/probe double-positive puncta (D+) in the cytosol. Data were obtained from single views as exemplified in A and B. (D) Ratios of dual-color (co-localization) labeling. DP/Pr ratio: number of dual-color puncta/number of probe-positive puncta; DP/dSmR ratio: number of dual-color puncta/number of dSmR3nd-mCherry-positive puncta. The number of embryos used for statistics was 3 (s-P3, 12 live imaging time points), 1 (as-P3, 7 time points), 8 (s-P5/6/7, 34 time points) and 2 (as-P5/6/7, 14 time points). Horizontal lines in the box plots show the median, boxes show the first to third interquartile ranges and whiskers represent the values outside the middle 50%. (E) Illustration of plasmids used for tracking of mRNAs at later stages. Tol2, Tol2 transposon LTRs. U6, ef1a and CMV represented promoters. (F) Normal morphology of embryos injected with plasmids for RNA imaging. One-cell-stage embryos were injected with plasmid pU6:actb2-1xP3;CMV:dSmR3nd-mCherry (20 pg per embryo) and observed at the indicated stage. (G,H) Tracking of actb2 mRNA at the shield stage. One-cell-stage embryos were injected with 1 ng dSmR3nd-mCherry protein and 20 pg pU6:actb2-1xP3;ef1α:GFP plasmid DNA and observed by confocal microscopy at 6 hpf. (G) Example of single embryos with multiple cells. Arrows indicated dSmR3nd-mCherry-positive puncta in the cytosol. N, nucleus. (H) Time-lapse live images of a single cell. See also Movie 5. (I-K) Tracking of actb2 (I) and chd (J) mRNAs by promoter-driven expression of RNA probes and dSmR3nd-mCherry. One-cell-stage embryos were injected with indicated plasmids, each at 20 pg per embryo, and collected at the shield stage for immunostaining with mCherry and dsRNA antibodies together with DAPI staining. Confocal images are shown (I,J) and the number of mCherry/dsRNA double positive puncta in the cytosol was calculated (K). Note that, in J, the weaker dsRNA signal in the mCherry-positive nucleus in the top panel compared with that in the bottom panel might be due to those cells in different phases of the cell cycle. Nc, number of observed cells. Violin plot outlines show the kernel probability density, long and short dashed lines illustrate the median and interquartile ranges, individually. **P<0.01; ****P<0.0001 (Welch's t-test). ns, not significant. Scale bars: 10 µm (A,B,G,I,J); 5 µm (A,B insets, H); 100 µm (F); 1 µm (H inset).

Dynamic tracking of endogenous actb2 mRNA simultaneously using mR3/dsRNA and MCP/MS2 systems. (A) Schematic of mRNA tracking with the two systems. The antisense actb2 3×P3-MS2 probe contains 3×P3, which is complementary to and forms dsRNA with 3′UTR, and six repeats of the MS2 aptamer, which can be recognized by the MCP-GFP fusion protein. (B) Time-lapse live images of dual-color-labeled RNA puncta. One-cell stage embryos were injected with 1 ng dSmR3nd-mCherry protein, 1 ng MCP-GFP protein and 300 pg antisense actb2 3×P3 MS2 probe and observed by confocal microscopy at the four-cell stage. Insets show magnification of boxed area. N, nucleus. See also Movie 6. (C) Number of fluorescent puncta (left) and ratio of co-localized puncta (right). Five embryos at 15 live imaging time points were used for calculation. DP/M, number of double-positive puncta/number of MCP-GFP-positive puncta; DP/mR, number of double-positive puncta/number of dSmR3nd-mCherry-positive puncta. Horizontal lines in the box plots show the median, boxes show the first to third interquartile ranges and whiskers represent the values outside the middle 50%. Scale bars: 10 µm; 2 µm (insets).

Acknowledgments
This image is the copyrighted work of the attributed author or publisher, and ZFIN has permission only to display this image to its users. Additional permissions should be obtained from the applicable author or publisher of the image. Full text @ Development