IMAGE

Fig. 2.

ID
ZDB-IMAGE-201217-8
Source
Figures for Zhang et al., 2020
Image
Figure Caption

Fig. 2.

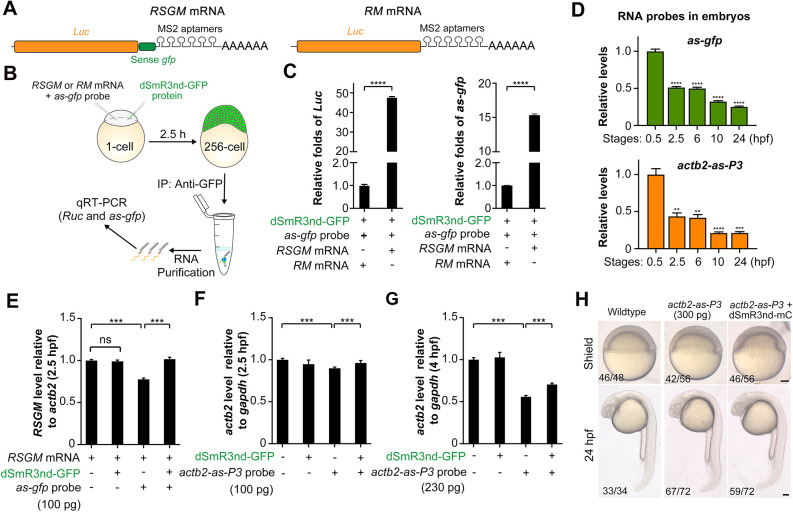
In vivo binding of dSmR3 with dsRNA and effect on target mRNA stability in the zebrafish embryo. (A) Illustration of RSGM and RM mRNA compositions. (B) Scheme of RNA immunoprecipitation: 300 pg RSGM or RM mRNA plus 350 pg as-gfp probe as well as 1 ng dSmR3nd-GFP protein were sequentially injected into one-cell-stage embryos. The dose was the amount per embryo. Approximately 2100 embryos in each group were collected at the 256-cell stage for analysis. (C) qRT-PCR analysis of Luc (left) or as-gfp (right) RNA levels using dsRNA precipitate. (D) Degradation dynamics of injected antisense probes. The actb2-as-P3 and as-gfp probes were injected, each at 100 pg per embryo, at the one-cell stage. About 40 embryos were collected at each desired stage. Total RNA was intramolecularly ligated before qRT-PCR detection. (E-G) qRT-PCR analysis of exogenous Luc (E) or endogenous acb2 (F,G) levels. One-cell embryos were injected with indicated materials and harvested at desired stages for analysis. Injection doses (per embryo): dSmR3nd-GFP protein, 1 ng; antisense RNA probes, 100 pg or 230 pg. (H) Normal development of wild-type embryos and those injected with 300 pg actb2-as-P3 alone or together with 1 ng dSmR3nd-mCherry (dSmR3nd-mC). Embryos were injected at the one-cell stage and imaged at the shield stage and 24 hpf. The ratio of embryos with representative morphology is indicated (bottom left). Data are mean±s.d. **P<0.01; ***P<0.001; ****P<0.0001 (Welch's t-test). ns, not significant. Scale bars: 100 µm.

Acknowledgments
This image is the copyrighted work of the attributed author or publisher, and ZFIN has permission only to display this image to its users. Additional permissions should be obtained from the applicable author or publisher of the image. Full text @ Development