
- Title
-
High Cysteinyl Leukotriene Receptor 1 Expression Correlates with Poor Survival of Uveal Melanoma Patients and Cognate Antagonist Drugs Modulate the Growth, Cancer Secretome, and Metabolism of Uveal Melanoma Cells
- Authors
- Slater, K., Heeran, A.B., Garcia-Mulero, S., Kalirai, H., Sanz-Pamplona, R., Rahman, A., Al-Attar, N., Helmi, M., O'Connell, F., Bosch, R., Portela, A., Villanueva, A., Gallagher, W.M., Jensen, L.D., Piulats, J.M., Coupland, S.E., O'Sullivan, J., Kennedy, B.N.
- Source
- Full text @ Cancers
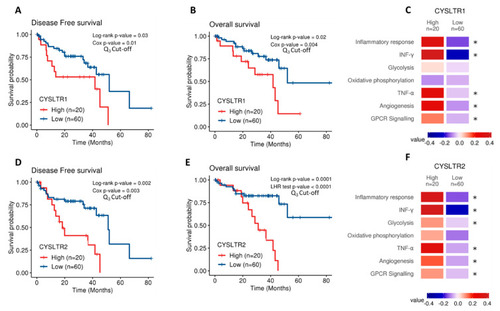
Analysis of |
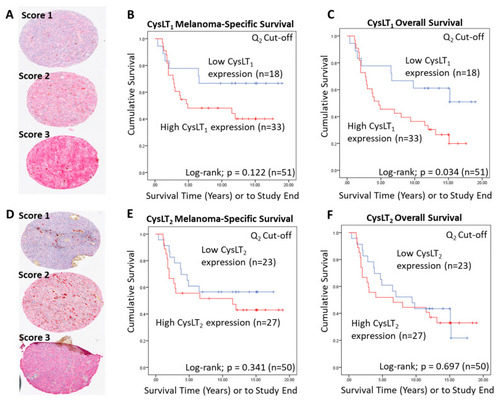
Examination of the prognostic value of CysLT1 and CysLT2 protein expression in primary UM samples by manual pathology. ( |
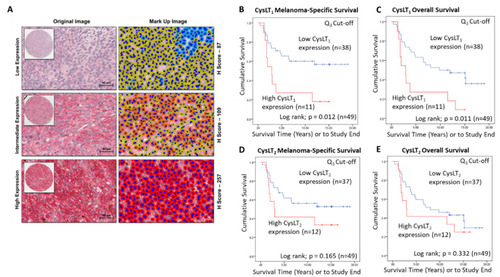
Examination of the prognostic value of CysLT1 and CysLT2 protein expression in primary UM patient samples by digital pathology analysis. ( |
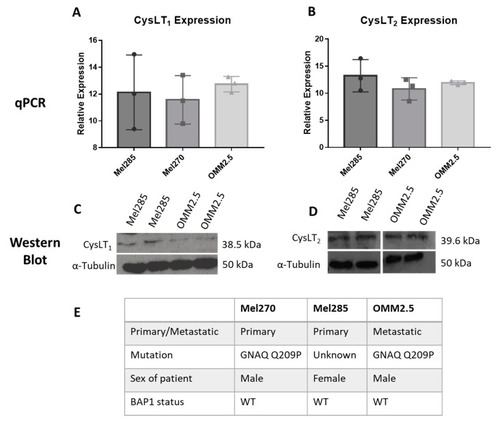
CysLT1 and CysLT2 are expressed in uveal melanoma cell lines. qPCR analysis confirmed the expression of CysLT1 ( |
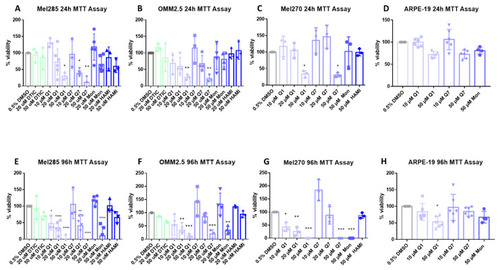
CysLT1 antagonists reduce cell viability in uveal melanoma cell lines. Graphs represent the effects of treatment with varying concentrations of dacarbazine (DTIC), quininib (Q1), 1,4-dihydroxy quininib (Q7), montelukast (Mon), and HAMI 3379 (HAMI) for 24 and 96 h in Mel285 ( |
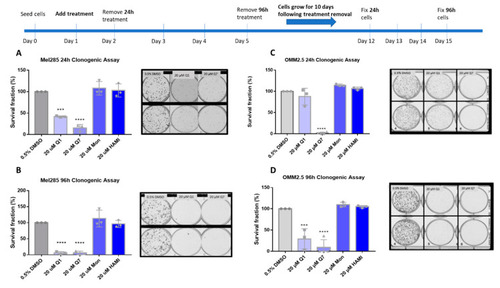
Quininib and 1,4-dihydroxy quininib reduce colony formation in Mel285 and OMM2.5 cells. Graphs show the percentage survival fraction of clones at 24 ( |
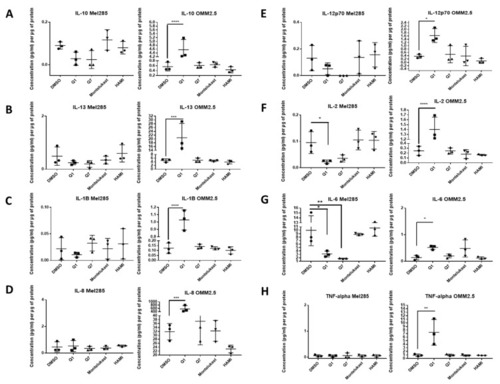
ELISA of cell conditioned media demonstrates that 24 h treatment with 20 µM quininib analogues decreases inflammatory markers in Mel285 cells but increases inflammatory markers in OMM2.5 cells. In OMM2.5 cells, 24 h treatment with quininib (Q1) significantly increased the secretion of IL-10 ( |
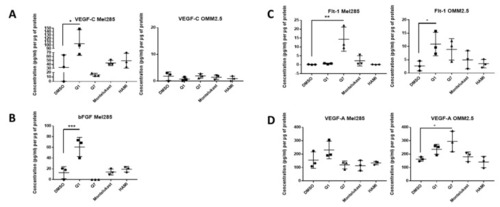
ELISA of cell conditioned media demonstrates that 24 h treatment with 20 μM quininib analogues increases angiogenic markers in Mel285 cells and OMM2.5 cells. In Mel285 cells, 24 h treatment with 20 μM quininib (Q1) significantly increased the secretion of VEGF-C ( |
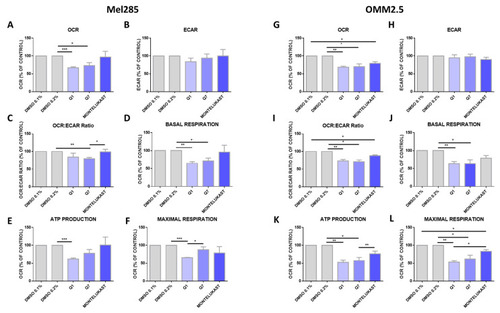
Quininib analogues inhibit oxidative phosphorylation, but not glycolysis, following 24 h treatment in Mel285 and OMM2.5 cell lines. Analysis of cellular metabolism in Mel285 ( |
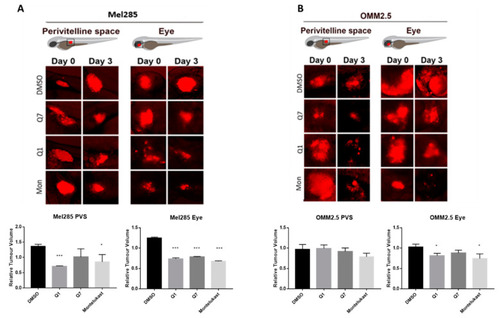
CysLT1 antagonists inhibit the growth of UM cell lines in in vivo zebrafish xenograft models. Zebrafish cell line-derived xenograft models were developed using Mel285 and OMM2.5 cell lines. Labelled UM cells were implanted into the perivitelline space (PVS) or vitreous of 48 hpf (hours post-fetilisation) PHENOTYPE:
|