IMAGE

Figure 2

ID
ZDB-IMAGE-201102-28
Source
Figures for Slater et al., 2020
Image
Figure Caption

Figure 2

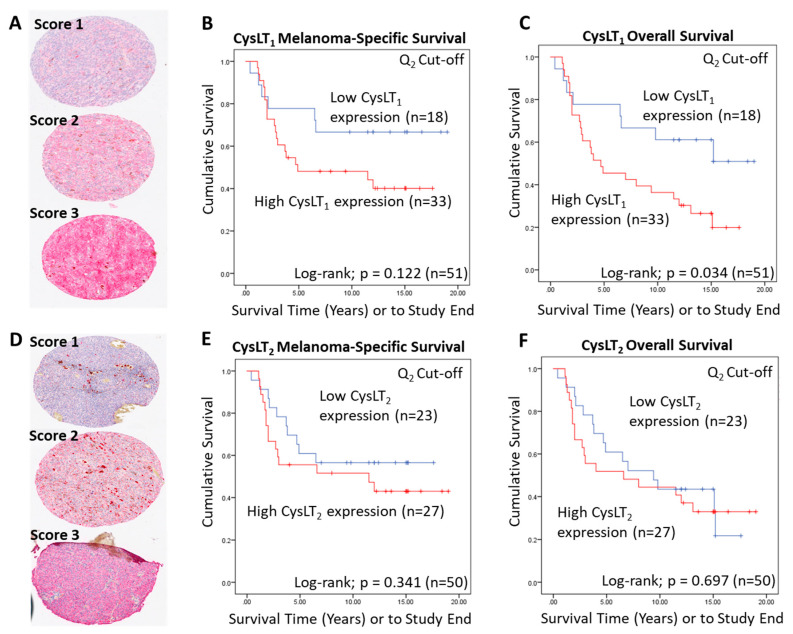
Examination of the prognostic value of CysLT1 and CysLT2 protein expression in primary UM samples by manual pathology. (A) Representative cores from the UM patient TMA designated with a score of 1, 2, or 3 for CysLT1 staining intensity. (B) Kaplan–Meier survival curve stratified based by high (red) or low (blue) CysLT1 expression and death by metastatic melanoma (n = 51; Log-rank; p = 0.122; HR 2.04; 95% CI 0.81–5.12). (C) High expression of CysLT1 (red) is significantly associated with reduced overall survival in primary UM patients (n =51; Log- rank; p = 0.034; HR 2.34; 95% CI 1.04–5.25) (D) Representative cores from the TMA designated with a score of 1, 2 or 3 for CysLT2 staining intensity. (E). Kaplan–Meier survival curve stratified based by high (red) or low (blue) CysLT2 expression and death by metastatic melanoma (n = 50; Log-rank; p = 0.341; HR 1.15, 95% CI 0.58–2.28). (F) Kaplan–Meier survival curve stratified based by high (red) or low (blue) CysLT2 expression and death by any cause (n = 50; Log-rank; p = 0.697; HR 1.15; 95% CI 0.58–2.28). The median was used as the cut-off point for high versus low expression for all Kaplan–Meier survival curves. Number of events indicates the number of deaths due to metastatic melanoma (B,E). Number of events indicates the number of deaths due to any cause (C,F).

Acknowledgments
This image is the copyrighted work of the attributed author or publisher, and ZFIN has permission only to display this image to its users. Additional permissions should be obtained from the applicable author or publisher of the image. Full text @ Cancers