
Image
|
Figure Caption
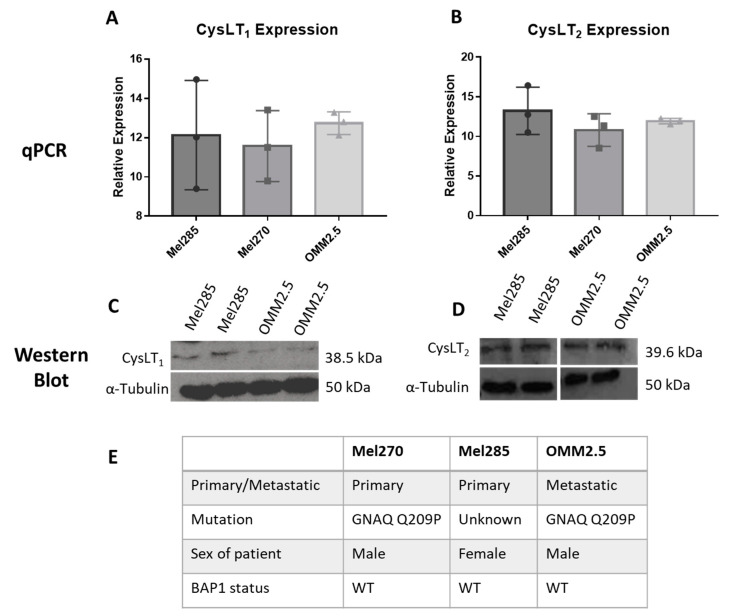
Figure 4
CysLT1 and CysLT2 are expressed in uveal melanoma cell lines. qPCR analysis confirmed the expression of CysLT1 (
Acknowledgments
This image is the copyrighted work of the attributed author or publisher, and
ZFIN has permission only to display this image to its users.
Additional permissions should be obtained from the applicable author or publisher of the image.
Full text @ Cancers