
- Title
-
Zebrafish Larvae Carrying a Splice Variant Mutation in cacna1d: A New Model for Schizophrenia-Like Behaviours?
- Authors
- Banono, N.S., Gawel, K., De Witte, L., Esguerra, C.V.
- Source
- Full text @ Mol. Neurobiol.
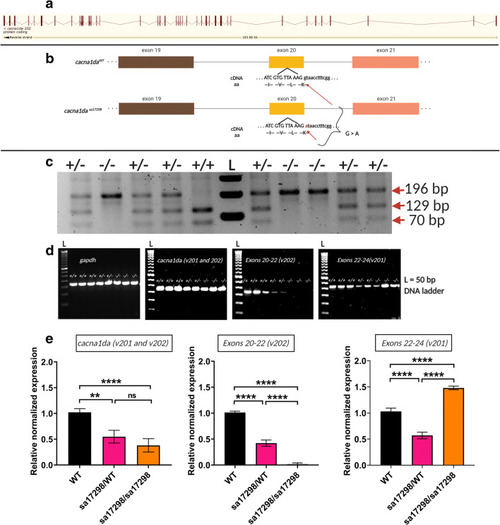
Zebrafish |
|
Zebrafish |
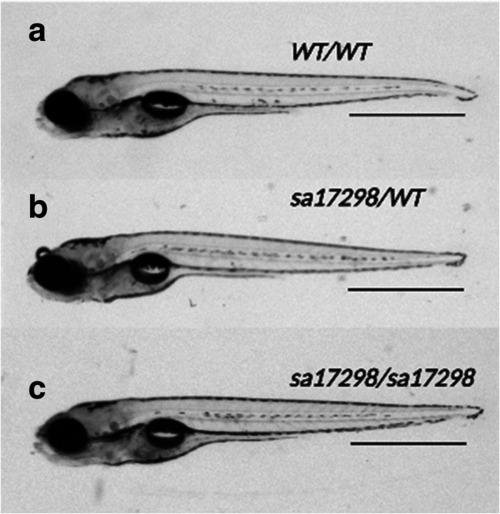
Morphology of PHENOTYPE:
|
|
Morphology of |
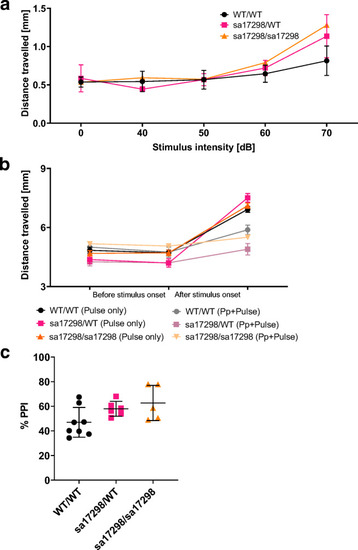
Acoustic startle response and PPI. |
|
Acoustic startle response and PPI. |
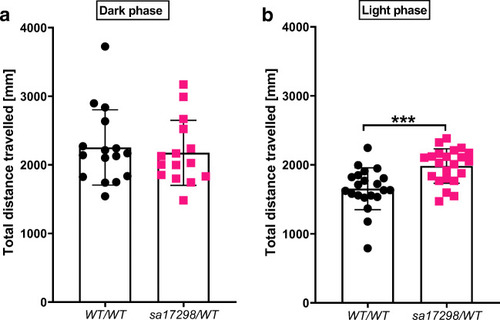
Locomotor activity of WT and heterozygous PHENOTYPE:
|
|
Locomotor activity of WT and heterozygous |
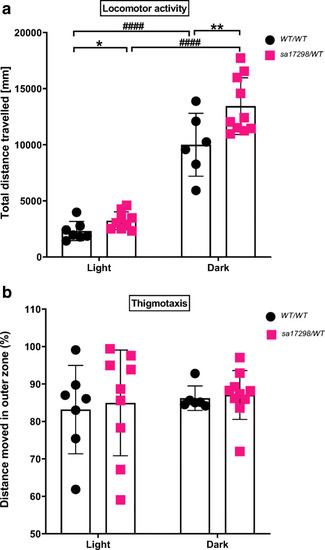
Behaviour of WT and heterozygous PHENOTYPE:
|
|
Behaviour of WT and heterozygous |
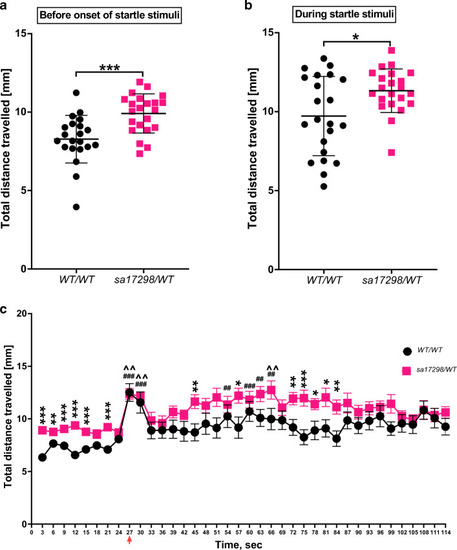
Startle response to dark flashes. PHENOTYPE:
|
|
Startle response to dark flashes. |
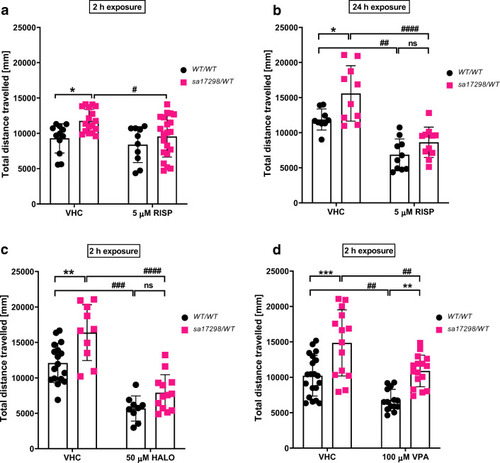
Effects of neuroactive drugs on the locomotor activity of 6-dpf WT and heterozygous PHENOTYPE:
|
|
Effects of neuroactive drugs on the locomotor activity of 6-dpf WT and heterozygous |
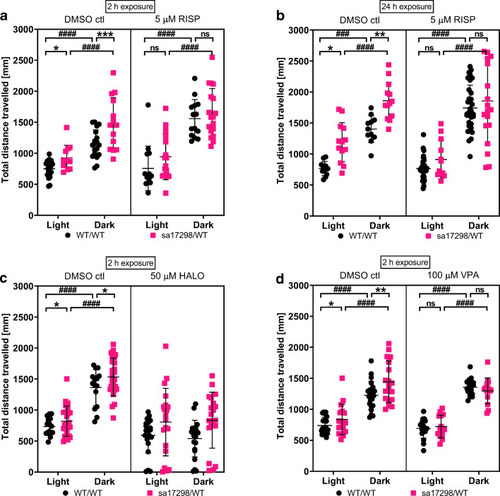
Effects of neuroactive drugs on the behaviour of 6-dpf WT and heterozygous PHENOTYPE:
|
|
Effects of neuroactive drugs on the behaviour of 6-dpf WT and heterozygous |
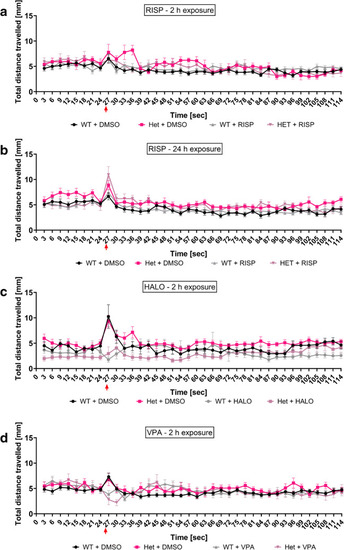
Time series graph of the effects of neuroactive drugs on the behaviour of 6-dpf WT and heterozygous |
|
Time series graph of the effects of neuroactive drugs on the behaviour of 6-dpf WT and heterozygous |