IMAGE

Fig. 3

ID
ZDB-IMAGE-220415-26
Source
Figures for Banono et al., 2020
Image
Figure Caption

Fig. 3

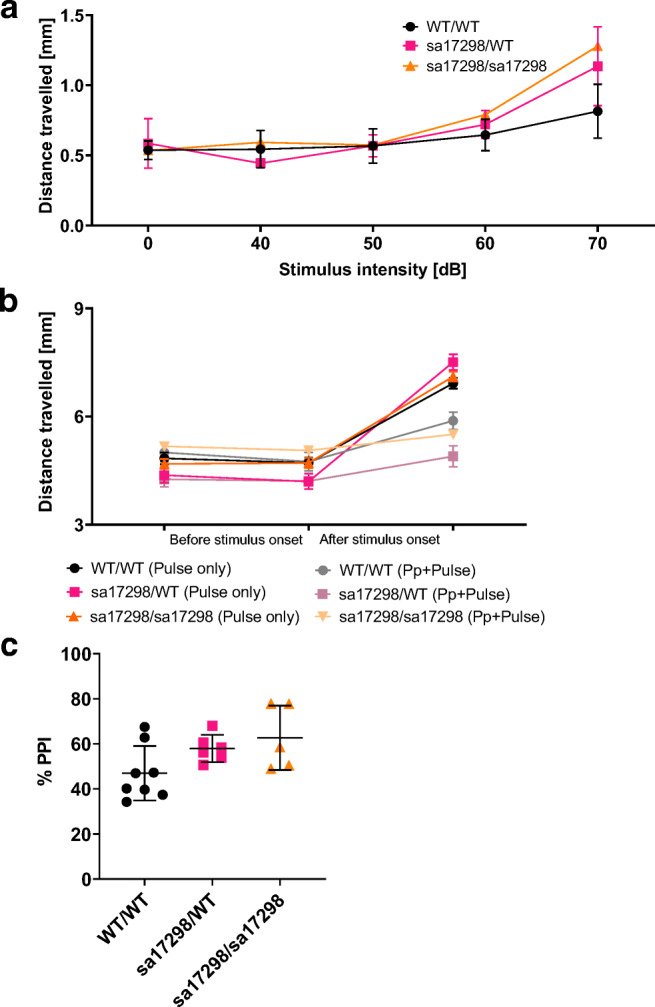
Acoustic startle response and PPI. a Graph of distance travelled when presented with different auditory stimuli. Data analysed using two-way ANOVA and presented as mean ± SEM. b Preceding a startle with a prepulse stimulus decreases the startle response of larvae. Data shown as mean ± SEM. c % PPI of larvae. One-way ANOVA revealed no overall significant difference among the groups. Tukey’s multiple comparison post hoc test however showed a strong tendency of homozygous mutant larvae towards significance (i.e. enhanced PPI). cacna1daWT/WT (N = 8), cacna1dasa17298/WT (N = 6) and cacna1dasa17298/sa17298 (N = 5), p > 0.05. Error bars represent mean ± SD. ASR, acoustic startle response; Pp, prepulse; PPI, prepulse inhibition. cacna1daWT/WT vs cacna1dasa17298/WT: p = 0.2002, cacna1daWT/WT vs cacna1dasa17298/sa17298: p = 0.0646, cacna1dasa17298/WT vs cacna1dasa17298/sa17298: p = 0.7702

Acknowledgments
This image is the copyrighted work of the attributed author or publisher, and ZFIN has permission only to display this image to its users. Additional permissions should be obtained from the applicable author or publisher of the image. Full text @ Mol. Neurobiol.