
Image
|
Figure Caption
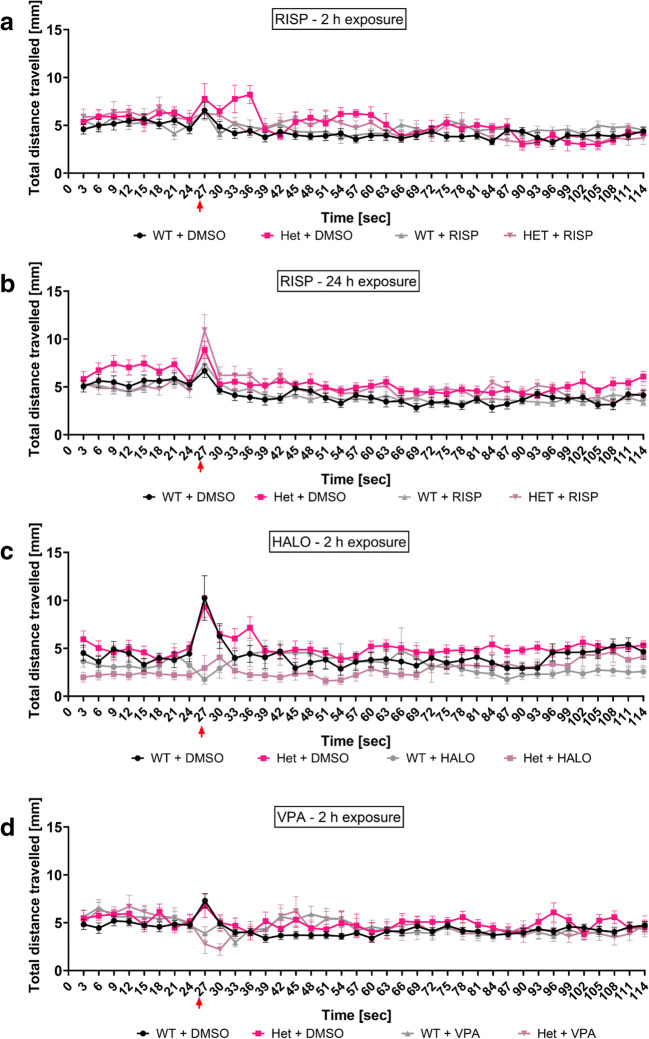
Fig. 9
Time series graph of the effects of neuroactive drugs on the behaviour of 6-dpf WT and heterozygous
Acknowledgments
This image is the copyrighted work of the attributed author or publisher, and
ZFIN has permission only to display this image to its users.
Additional permissions should be obtained from the applicable author or publisher of the image.
Full text @ Mol. Neurobiol.