FIGURE SUMMARY
Title

Transgenerational inheritance of impaired larval T cell development in zebrafish

Authors
Iwanami, N., Lawir, D.F., Sikora, K., O Meara, C., Takeshita, K., Schorpp, M., Boehm, T.
Source
Full text @ Nat. Commun.

Characterization of a hypomorphic allele of <italic>dnmt1</italic>.

a Impaired larval T cell development in mutant fish. Diagnostic whole-mount RNA in situ hybridization pattern 23in wild-type and dnmt1 mutant fish at 5 dpf using rag1 (thymus encircled in black), and gh (hypophysis encircled in blue) specific probes (left panel); hybridization pattern for foxn1, a marker of thymic epithelium59,60 (right panel). Scale bar, 100 μm. Panels are representative of 25 animals each. b Schematic of functional domains in the dnmt1 protein (not to scale); NLS, nuclear localization signal; RFTS, replication foci targeting site; CXXC, cysteine-rich domain; BAH, bromo-adjacent homology domains 1 and 2; MTase, catalytic domain. Arrow, approximate position of the amino acid replacement in the target recognition domain, TRD. c The asparagine residue mutated in the dnmt1t25501 allele occurs in an evolutionarily conserved region of the enzyme. d In the structure of the mouse Dnmt1 protein in complex with a hemi-methylated substrate, close apposition of the mutated asparagine residue to the substrate DNA in the catalytic site is observed26 (PDB ID: 4DA4). e, f Hypomethylation of cytosine residues in CpG dinucleotides of DNA extracted from whole body of 18 dpf larvae (e) (n = 3) and sperm of adult homozygous mutants (f) (n = 3). In (e) and (f), density refers to the fraction of CG sites with a particular methylation ratio. g Mean methylation levels of CG dinucleotides for DNAs shown in (e) and (f). Values shown represent mean ± mad; n = 3. Source data are provided as Source Data file.

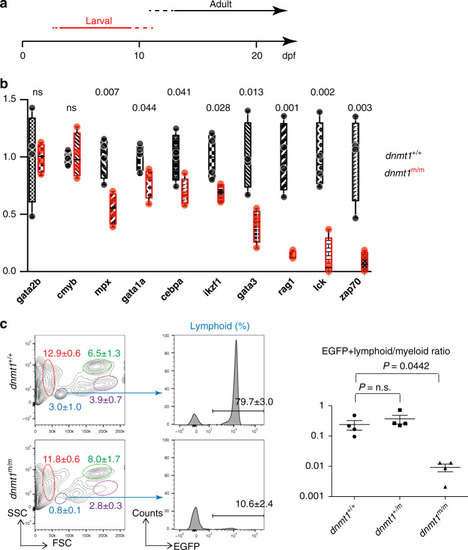
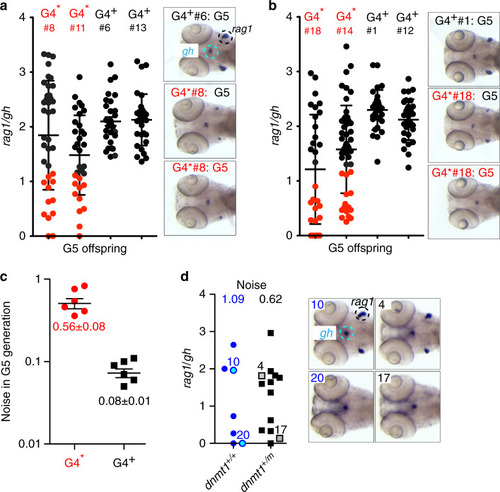
Hematopoietic abnormalities in <italic>dnmt1</italic> mutant fish.

a Schematic indicating the two waves of T cell development in zebrafish, operationally referred to as larval and adult phases; the larval phase depends on the activity of the ikzf1 transcripton factor28,46. In the forward genetic screen, fish were analyzed at 5 dpf. b Expression patterns of selected genes associated with hematopoietic development in 5 dpf G2 embryos. Levels were determined by qPCR and normalized to the levels of actb1 (n = 4; mean; whiskers represent maximum and minimum values; individual data points are indicated). c Adult lymphopoiesis fails in mutant fish. Flow cytometric analyses of whole kidney marrow (WKM) cells47 of wild-type and dnmt1 mutants, both transgenic for an ikzf1-EGFP reporter27,28 (left panels). Circles denote different blood cell populations in adult wild-type fish: red, erythrocytes; blue, lymphocytes; magenta, precursors; green, myelomonocytes. Percentages (mean ± SD) of each population in WKM preparations are indicated (n = 4, for both genotypes; left panels). Analysis of EGFP-positive cells in the lymphocyte gates; percentages of positive cells are indicated in the histograms (n = 4, for both genotypes; middle panel), and enumerated (right panels). FSC, forward light scatter; SSC, side light scatter. Source data are provided as Source Data file. For b, c, unpaired two-tailed t test with Welch´s for unequal variance and Bonferroni´s correction for multiple tests.

Impaired T cell development in 5 dpf larvae.

a Structure of pedigrees. A cross of male and female carriers gives rise to the three genotypes of the G2 generation that are used to establish the G3 generation. b The rag1/gh ratio as determined by RNA in situ hybridization is shown for 5 dpf fish of the indicated genotypes (bottom) arising from the indicated parental genotypes (top); male genotypes are shown in upper row. Each data point represents one animal; t test, two-tailed; mean ± s.e.m. c Representative RNA in situ patterns on which the calculation of rag1/gh ratios was done are shown on the right for the animals identified by numbers in panel (b). The thymus region (identified by rag1 signal) and the hypohysis (identified by the gh signal) are encircled; because of the cell-type specificity of the mutant phenotype, the rag1/gh ratio serves as a convenient normalization measure for the RNA in situ hybridization protocol. d Thymopoiesis in adult animals of the indicated generations and genotypes. Histological sections of thymi were stained with hematoxylin/eosin; note the alymphoid thymus in dnmt1m/m fish. In (c, d), scale bars: 0.1 mm. Source data are provided as Source Data file.

Transgenerational inheritance of failing larval T cell development.

a Structure of pedigree; the genotypes and sex of animals is indicated. White boxes, wild-type animals unrelated to the dnmt1-mutant lineage; blue boxes, genotypically wild-type animals arising from various crosses in the dnmt1-mutant lineage. The presence (+) or absence (−) of larval and adult phases of T cell development in different generations of the pedigree are indicated on the right, with colors matching the relevant genotypes. The ± sign indicates that larval T cell development is impaired in some but not all G4 and G5 animals. b Genotypically wild-type (dnmt1+/+) males and females of the G4 generation give rise to off-spring with (G4*) or without (G4+) impaired larval T cell development when crossed to wild-type animals. c Normal adult hematopoiesis in fish of different genetic backgrounds. Whole kidney marrow cells were analyzed by flow cytometry (see Fig. 2c, left panel) and cell numbers in the lymphoid and myeloid gates were counted47. The genotype of animals is indicated to the right; TLEK and Assam represent wild-type strains. Note the normal lymphoid/myeloid ratios in adult G4* animals. Each data point represents one animal. Source data are provided as Source Data file.

Variable levels of larval T cell development in the G5 generation.

a Extent of T cell development (expressed as rag1/gh ratio) in the G5 generation arising from dnmt1+/+ male G4 fish (c.f., a). Red dots represent values of thymopoietic index of animals in G5 clutches arising from a G4* parent whose rag/gh ratios lie outside 2 standard deviations of values observed in G5 clutches arising from G4+ parents. Representative RNA in situ results are shown for G5 fish. b Extent of T cell development in the G5 generation arising from dnmt1+/+ female G4 fish. c Noise (calculated as variance/mean) values of rag1/gh data in G5 clutches arising from G4* and G4+ parents (mean ± s.e.m.).d Extent of T cell development (expressed as rag1/gh ratio) in the G5 generation arising from dnmt1+/m male G4* fish; the mean noise values are indicated at the top (left panel). Representative RNA in situ patterns on which the calculation of rag1/gh ratios was performed are shown on the right for the animals identified by numbers in the left panel. In (ad), each data point represents one animal. Source data are provided as Source Data file.

Dynamic changes of DNA methylation patterns in the G4 generation.

a Mean methylation ratios of CpG dinucleotides in sperm DNAs of G2 dnmt1+/+ and dnmt1m/m animals (left panel), and genotypically wild-type (dnmt1+/+) males of the G4 generation giving rise to off-spring with (G4*) or without (G4+) impaired larval T cell development when crossed to wild-type females (right panel). b History of methylation of DMRs distinguishing G4+ and G4* animals. The y-axis gives the number of DMRs that are either hypermethylated or hypomethylated in sperm DNA of in G4* versus G4+ animals. These DMRs were either indistinguishable in sperm of the G2 generation or were hypomethylated in G2m/m versus G2+/+ animals. c, d Non-random distribution of DMRs in the genome of sperm of G4* relative to G4+ animals. Most DMRs represent hypomethylated sites c. Distribution of DMRs across the 4 most affected chromosomes (scale in Mb); the mean methylation differences are indicated; positive values indicate hypermethylation of DMRs in G4* sperm, negative values indicate hypomethylation of DMRs in G4* sperm (d). Source data are provided as Source Data file.

Molecular basis of transgenerational inheritance of impaired larval T cell development.

a Characterization of the runx3 locus. In the first three rows, various chromatin marks are indicated15. The structures of known transcripts across the runx3 locus are shown below. The positions of candidate DMRs called in G2 sperm DNAs are shown underneath the transcript structures, as are the three candidate DMRs discovered in G4+ and G4* sperm DNA. The position of the only annotated runx3 CpG island is indicated above the CpG density track. The filtered coverage across the locus in the three WGBS replicates is indicated as well as the extent of methylation in the CpGs that were evaluated in the comparison of G4+ and G4* sperm DNAs. The bottom row indicates the positions of repeat across the locus. Note that the hypermethylated DMR in G4* sperm DNA coincides with a peak in H3K4 methylation. b DNA methylation levels in DMRs associated with runx3 and rptor genes in sperm of G4 males. For runx3, the data pertain to the three replicates of the DMR marked with an asterisk in a; for rptor, the relevant DMR is indicated by an asterisk in Supplementary Fig. 5b. c Combined knock-down of runx3 and rptor by anti-sense oligonucleotides impairs larval T cell development. Each data point represents one animal analyzed at 5 dpf by RNA in situ hybridization. In (b, c), each data point represents one animal; t-test, two-tailed; mean ± s.e.m. Source data are provided as Source Data file.

Acknowledgments
This image is the copyrighted work of the attributed author or publisher, and ZFIN has permission only to display this image to its users. Additional permissions should be obtained from the applicable author or publisher of the image. Full text @ Nat. Commun.