IMAGE

Fig. 5

ID
ZDB-IMAGE-201003-204
Source
Figures for Iwanami et al., 2020
Image
Figure Caption

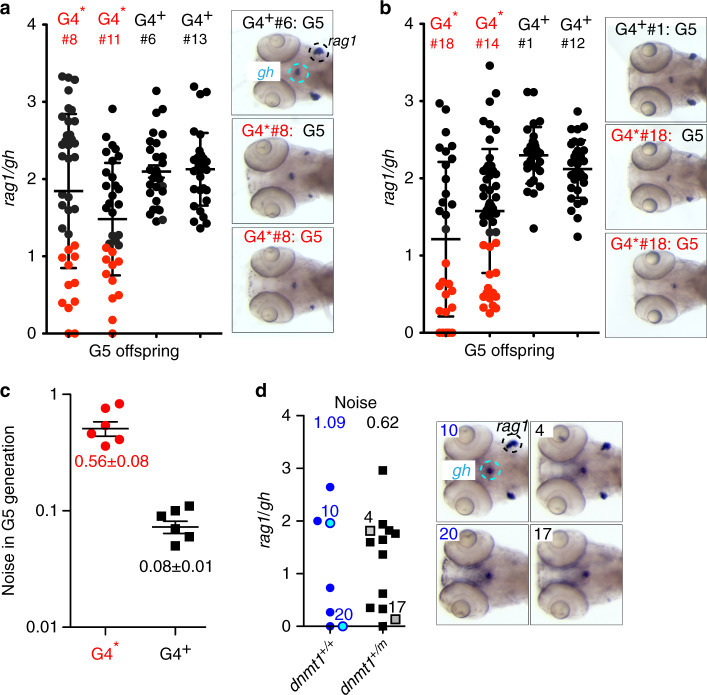
Fig. 5 Variable levels of larval T cell development in the G5 generation.

a Extent of T cell development (expressed as rag1/gh ratio) in the G5 generation arising from dnmt1+/+ male G4 fish (c.f., a). Red dots represent values of thymopoietic index of animals in G5 clutches arising from a G4* parent whose rag/gh ratios lie outside 2 standard deviations of values observed in G5 clutches arising from G4+ parents. Representative RNA in situ results are shown for G5 fish. b Extent of T cell development in the G5 generation arising from dnmt1+/+ female G4 fish. c Noise (calculated as variance/mean) values of rag1/gh data in G5 clutches arising from G4* and G4+ parents (mean ± s.e.m.).d Extent of T cell development (expressed as rag1/gh ratio) in the G5 generation arising from dnmt1+/m male G4* fish; the mean noise values are indicated at the top (left panel). Representative RNA in situ patterns on which the calculation of rag1/gh ratios was performed are shown on the right for the animals identified by numbers in the left panel. In (ad), each data point represents one animal. Source data are provided as Source Data file.

Acknowledgments
This image is the copyrighted work of the attributed author or publisher, and ZFIN has permission only to display this image to its users. Additional permissions should be obtained from the applicable author or publisher of the image. Full text @ Nat. Commun.