|
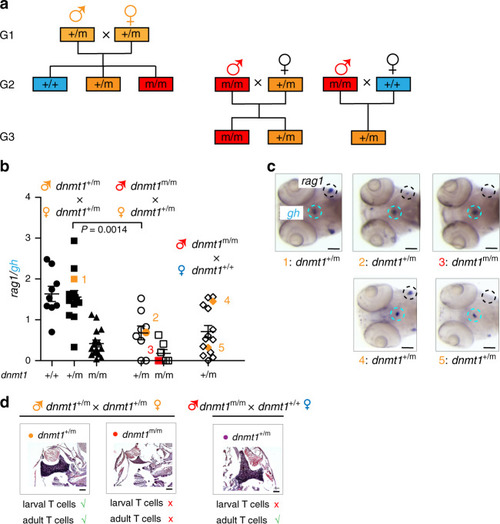
Impaired T cell development in 5 dpf larvae.a Structure of pedigrees. A cross of male and female carriers gives rise to the three genotypes of the G2 generation that are used to establish the G3 generation. b The rag1/gh ratio as determined by RNA in situ hybridization is shown for 5 dpf fish of the indicated genotypes (bottom) arising from the indicated parental genotypes (top); male genotypes are shown in upper row. Each data point represents one animal; t test, two-tailed; mean ± s.e.m. c Representative RNA in situ patterns on which the calculation of rag1/gh ratios was done are shown on the right for the animals identified by numbers in panel (b). The thymus region (identified by rag1 signal) and the hypohysis (identified by the gh signal) are encircled; because of the cell-type specificity of the mutant phenotype, the rag1/gh ratio serves as a convenient normalization measure for the RNA in situ hybridization protocol. d Thymopoiesis in adult animals of the indicated generations and genotypes. Histological sections of thymi were stained with hematoxylin/eosin; note the alymphoid thymus in dnmt1m/m fish. In (c, d), scale bars: 0.1 mm. Source data are provided as Source Data file.
|