FIGURE SUMMARY
Title

Isoform-specific characterization of class I histone deacetylases and their therapeutic modulation in pulmonary hypertension

Authors
Chelladurai, P., Dabral, S., Basineni, S.R., Chen, C.N., Schmoranzer, M., Bender, N., Feld, C., Nötzold, R.R., Dobreva, G., Wilhelm, J., Jungblut, B., Zhao, L., Bauer, U.M., Seeger, W., Pullamsetti, S.S.
Source
Full text @ Sci. Rep.

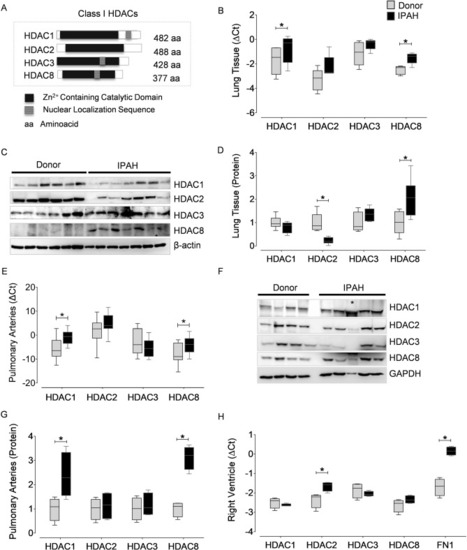
Expression of class I HDAC isoforms are altered in different cardiopulmonary tissues from human PAH. (A) Schematic representation of the mammalian class I HDACs. (B) Real-time quantitative polymerase chain reaction (qPCR) analysis was performed with primer pairs (Supplementary Table 1) on the complementary DNA (cDNA) synthesized from the RNA isolated from human lung homogenates of healthy donors (n = 5) and IPAH (n = 5) patients. All values were normalized against hypoxanthine phosphoribosyltransferase (HPRT). (C) Western blot was performed on human lung homogenates from donors (n = 6) and PAH (n = 7) patients using validated antibodies listed in Supplementary Table 2. (D) Blots from lung homogenates were quantified by densitometry and are represented as box plots after normalization to internal loading control. (E) The transcription levels of HDAC isoforms were quantified using qPCR on the total RNA isolated from the laser micro-dissected intrapulmonary arteries (> 50 µm and < 200 µm) dissected from the lungs of human donor (n = 12) and PAH (n = 10) patients. Results are presented as expression relative to that of HPRT using the ∆Ct method. (F) Western blots were performed on the lysates prepared from donor (n = 4) and PAH (n = 5) pulmonary arteries (PA). (G) Blots from PAs were further quantified by densitometry and are represented as bar charts. GAPDH was used as a loading control. Asterisk symbol (*) within the western blot indicates that the protein was isolated from the PAs of an Eisenmenger syndrome patient, and was not included in the quantitative comparison of protein expression levels between PAH patients and donors. Besides, Eisenmenger syndrome is also classified as a part of Group 1 (PAH, 1.4.4.1) in the clinical classification of PH. (H) qPCR analysis was performed on the RNA isolated from human right ventricle of healthy donors (n = 4) and PAH (n = 4) patients. *p < 0.05 (Student's t-test), indicates significant differences between PAH and donors.

Immunolocalization of class I HDAC isoforms in human lungs from donors and IPAH patients. Representative microscopic pictures of human pulmonary arteries immunostained for (A) HDAC1, (B) HDAC2 and (C) HDAC8 expression in human donor and IPAH lung sections. HDAC (in green fluorescence) expression was localized to different vascular by staining for cell-specific markers such as von Willebrand factor (vWF, Red) for endothelial cells, α-smooth muscle actin (SMA or ACTA2, Red) for smooth muscle cells and collagen I (Col1 or COL1A1, Red) associated with adventitial fibroblasts, while the nucleus was counter-stained with DAPI (Blue). Scale bar: 50 µm.

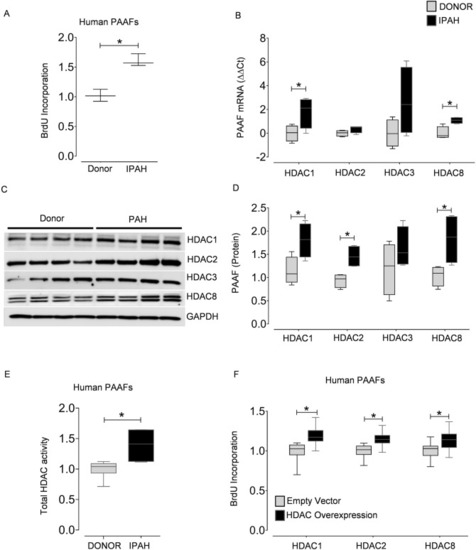
Class I HDAC isoforms are overexpressed in PAH and are associated with adventitial fibroblast proliferation. Cell proliferation was assessed by BrdU incorporation in (A) donor- and IPAH-PAAFs (n = 3) cultured ex vivo. Data was normalized to respective donors. (B) qPCR analysis of HDACs was performed on the RNA isolated from the PAAFs harvested from healthy donors (n = 4) and PAH (n = 4) patients. ∆Ct values were normalized to β-2 microglobulin (β2M) and further normalized (∆∆Ct) to donor controls. (C) Western blots were performed on lysates extracted from human PAAFs of healthy donors (n = 4) and PAH (n = 4) patients. (D) Blots were quantified by densitometry and are represented as box plots after normalization to internal loading control. (E) HDAC activity (OD/min/mg) was measured in PAAFs harvested from healthy donors (n = 3) and PAH (n = 3) patients using colorimetric assay kit (Epigenase HDAC Activity/Inhibition Assay Kit, Epigentek). (F) Overexpression of HDACs was achieved by transient transfection of donor-PAAFs (n = 3) with validated HDAC1, HDAC2, HDAC8 plasmids, and their functional effects on proliferation was assessed by BrdU incorporation, 48 hours (h) post-transfection. Empty vector plasmid was used as negative control. Data was normalized to untransfected cells. In all plots, significant differences between corresponding comparisons are indicated as *p < 0.05, Student's t-test.

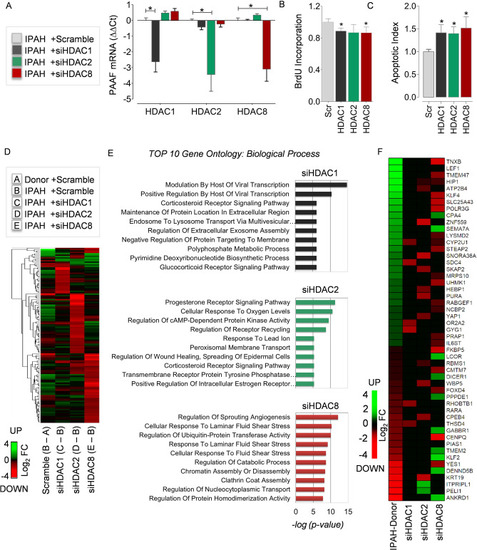
Transcriptome and pathways regulated by HDAC isoforms in PAH. RNA-interference was achieved by transient transfection of IPAH-PAAFs cultured ex vivo with validated HDAC1, HDAC2 and HDAC8 siRNAs. (A) qPCR analysis was performed on the RNA isolated from IPAH-PAAFs (n = 3), 24 h post-transfection. ∆Ct values were calculated using β2M as reference and further normalized (∆∆Ct) to the respective solvent concentrations (DMSO or water). (B) Functional effects of RNA-interference on fetal calf serum (FCS) induced IPAH-PAAF proliferation was assessed by BrdU incorporation, 48 h post-transfection. Similarly, (C) functional effects of RNA-interference on serum starvation (0.1% FCS) induced apoptosis in IPAH-PAAFs was assessed by Cell Death Detection ELISAPLUS, 48 h post-transfection. Data was normalized to untransfected cells and visualized (IPAH; n = 3; *p < 0.05 versus scrambled siRNA, Student's t-test). (D) Transcriptomic alterations between IPAH and donor-PAAFs (B-A) and the genome-wide transcriptional targets of individual HDAC isoforms was profiled using microarray-based expression analysis following RNA-interference in IPAH-PAAFs, along with scrambled siRNA as a negative control. Heatmap shows hierarchical clustering of all genes selected for at least one of the comparisons C-B, D-B, and E-B (log2FC ≤ − 1 or log2FC ≥  + 1, FDR < 0.05) (Supplementary Table 3). The colors indicate log2 fold-differences between the compared groups. Green and red indicate higher and lower expression, respectively, in the group that is given first, compared to the group given second. (E) Gene ontology (GO) enrichment analysis was performed to identify GO terms associated with biological process (BP, − log2(p-value) < 0.05) and top 10 GO terms for each comparison (C-B, D-B, and E-B) were displayed as bar charts (Supplementary Table 4). (F) Differentially expressed protein coding genes that are differentially expressed in comparison (B-A) and in at least one of the siRNA knockdown comparisons (C-B, D-B, E-B) were enlisted and displayed as a heatmap (Supplementary Table 3). FC Fold change, FDR False discovery rate.

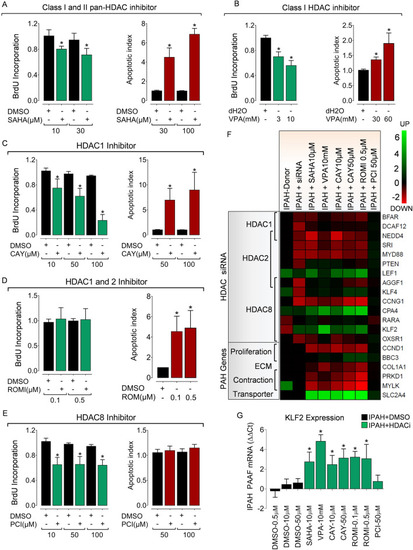
Isoform-selective HDAC activity inhibition reverses hypertensive phenotypes in PAH fibroblasts ex vivo. Pharmacological HDAC inhibition suppresses hyper-proliferative phenotype and reverses resistance to apoptosis in IPAH-PAAFs ex vivo. IPAH-PAAFs were treated with increasing concentrations of commercially available (A) pan-HDAC inhibitor Vorinostat (SAHA), (B) class-selective Valproic acid (VPA) and isoform selective inhibitors such as (C) CAY10398, (D) Romidepsin, (E) PCI34051 or their respective solvents (DMSO or water). Cell proliferation was assessed by BrdU incorporation and induction of apoptosis was assessed by Cell Death Detection ELISAPLUS, 24 h post-treatment. Absorbance values obtained for HDAC inhibitor and solvent treatments were normalized to the BrdU incorporation of untreated cells. Data are represented as mean ± SEM (n = 3; *p < 0.05 versus DMSO or water, Student's t-test). (F) The impact of HDAC activity inhibition on the modulation of transcription targets of HDAC isoforms (Fig. 4D) and PAH-relevant genes in IPAH-PAAFs (n = 3) was evaluated by qPCR. ∆Ct values were calculated using β2M as reference. Inhibitor treatments were further normalized (∆∆Ct) to the respective solvent concentrations (DMSO, dd.H2O). Heatmap representation also includes Log2 fold change values (Supplementary Table 3) obtained from the microarray dataset (columns 1 and 2). (G) Example plot visualizing relative KLF2 mRNA (∆∆Ct) expression. Data are represented as mean ± SEM (n = 3; *p < 0.05 versus solvent control, Student's t-test).

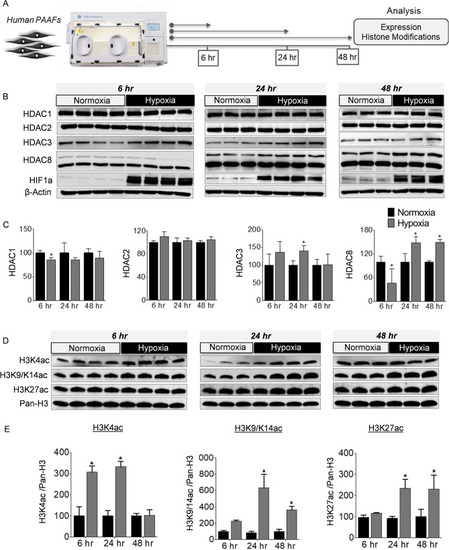
Regulation of class I HDACs and histone modifications by hypoxia ex vivo. (A) Schematic representation of the experimental plan to study the regulation of HDAC expression and dynamic changes in histone acetylation levels in donor-PAAFs (n ≥ 3) exposed to hypoxia. (B) Western blots were performed on proteins extracted from human donor-PAAFs exposed to hypoxia. (C) Blots were quantified by densitometry and are represented as bar charts after normalization to internal loading control, β-actin. For HDAC8, both the upper (Fig. 6) and lower bands (in Fig. S3) were quantified separately. (D) To determine the effect of hypoxia exposure on histone modifications, western blot analysis was performed on extracts from donor-PAAFs exposed to hypoxia with antibodies raised against specific post-translational modification of histones associated with transcription activation (H3K4ac; H3K9/K14ac) and active enhancers (H3K27ac). (E) Blots were quantified by densitometric analysis and are represented as bar charts after normalization to internal loading control (Pan-histone H3). Significant differences found in comparison between the treatment (hypoxia) and control groups (normoxia) are indicated by an asterisk symbol (*p < 0.05, Two-way ANOVA with Bonferroni post-tests for multiple comparisons). K-Lysine, ac acetylation.

Evaluation of isoform-selective HDAC inhibitors in chronic hypoxia-induced PH and RV hypertrophy in vivo. (A) Rats were divided into seven groups and exposed to, (1) normoxia (N), (2) hypoxia (H) for 4 weeks, and hypoxia plus (3) CAY10398, (4) PCI34051 (P), (5) VPA (V), (6) SAHA (S) and (7) Romidepsin (R). Compounds were administered during the last 2 weeks of 4 week hypoxia exposure (n = 6 rats were assigned per group treated with isoform-selective inhibitors). At the end of experiment, haemodynamic parameters were measured and analysed in the animals that completed the treatment regimen. The parameters analysed were (B) mean pulmonary artery pressure (mPAP), (C) right ventricular systolic pressure (RVSP), (D) systolic blood pressure, (SBP), (E) right ventricular hypertrophy (RV/LV + septum), and (F) percentage of muscularised vessels. Data are represented as bar charts (n ≥ 3; *p < 0.05 versus hypoxia, §p < 0.05 for hypoxia versus normoxia, one-way ANOVA followed by Tukey's multiple comparisons test). To study the effect of HDAC inhibitors on angiogenesis in vivo, the zebrafish embryos were treated with different concentrations of isoform-selective HDAC inhibitors (G) Romidepsin (1 µM), (H) PCI34051 (100 µM), (I) CAY10398 (100 µM), (J) class-selective inhibitor VPA (10 mM), and pan-HDAC inhibitors such as (K) SAHA (100 µM), (L) TSA (1 µM) or their solvents (DMSO or dd.H2O) 19 hours post fertilization (hpf). HDAC inhibitors were administered to zebrafish embryos at 19 hpf. More than 25 embryos per group were screened for each inhibitor. The zebrafish line employed in this study was generated from Tg(fli1a:nEGFP)y7 (engineered to exhibits green fluorescence), and Tg(kdrl:HsHRAS-mCherry)s896 (engineered to exhibit red fluorescence) to monitor in vivo vascular network.

Acknowledgments
This image is the copyrighted work of the attributed author or publisher, and ZFIN has permission only to display this image to its users. Additional permissions should be obtained from the applicable author or publisher of the image. Full text @ Sci. Rep.