IMAGE

Figure 1

ID
ZDB-IMAGE-200805-15
Source
Figures for Chelladurai et al., 2020
Image
Figure Caption

Figure 1

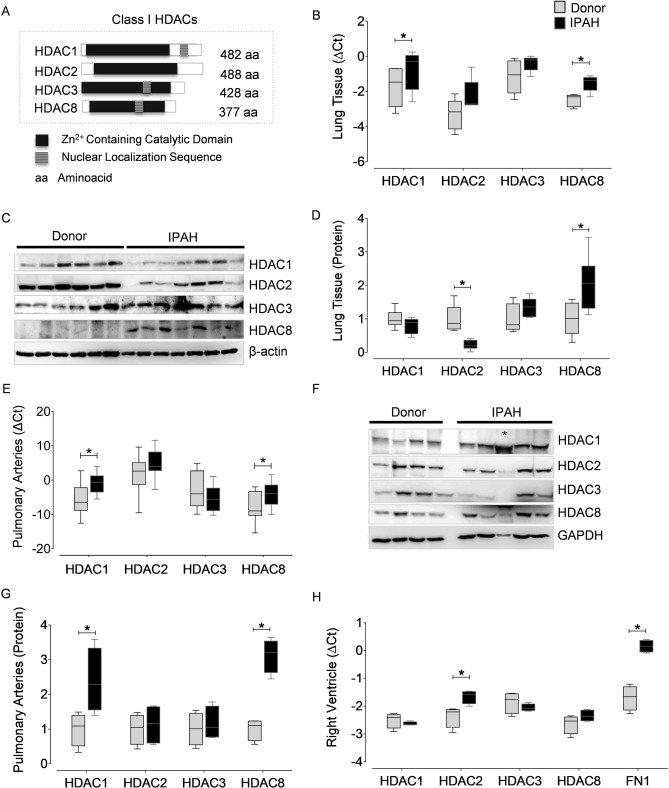
Expression of class I HDAC isoforms are altered in different cardiopulmonary tissues from human PAH. (A) Schematic representation of the mammalian class I HDACs. (B) Real-time quantitative polymerase chain reaction (qPCR) analysis was performed with primer pairs (Supplementary Table 1) on the complementary DNA (cDNA) synthesized from the RNA isolated from human lung homogenates of healthy donors (n = 5) and IPAH (n = 5) patients. All values were normalized against hypoxanthine phosphoribosyltransferase (HPRT). (C) Western blot was performed on human lung homogenates from donors (n = 6) and PAH (n = 7) patients using validated antibodies listed in Supplementary Table 2. (D) Blots from lung homogenates were quantified by densitometry and are represented as box plots after normalization to internal loading control. (E) The transcription levels of HDAC isoforms were quantified using qPCR on the total RNA isolated from the laser micro-dissected intrapulmonary arteries (> 50 µm and < 200 µm) dissected from the lungs of human donor (n = 12) and PAH (n = 10) patients. Results are presented as expression relative to that of HPRT using the ∆Ct method. (F) Western blots were performed on the lysates prepared from donor (n = 4) and PAH (n = 5) pulmonary arteries (PA). (G) Blots from PAs were further quantified by densitometry and are represented as bar charts. GAPDH was used as a loading control. Asterisk symbol (*) within the western blot indicates that the protein was isolated from the PAs of an Eisenmenger syndrome patient, and was not included in the quantitative comparison of protein expression levels between PAH patients and donors. Besides, Eisenmenger syndrome is also classified as a part of Group 1 (PAH, 1.4.4.1) in the clinical classification of PH. (H) qPCR analysis was performed on the RNA isolated from human right ventricle of healthy donors (n = 4) and PAH (n = 4) patients. *p < 0.05 (Student's t-test), indicates significant differences between PAH and donors.

Acknowledgments
This image is the copyrighted work of the attributed author or publisher, and ZFIN has permission only to display this image to its users. Additional permissions should be obtained from the applicable author or publisher of the image. Full text @ Sci. Rep.