IMAGE

Figure 3

ID
ZDB-IMAGE-200805-17
Source
Figures for Chelladurai et al., 2020
Image
Figure Caption

Figure 3

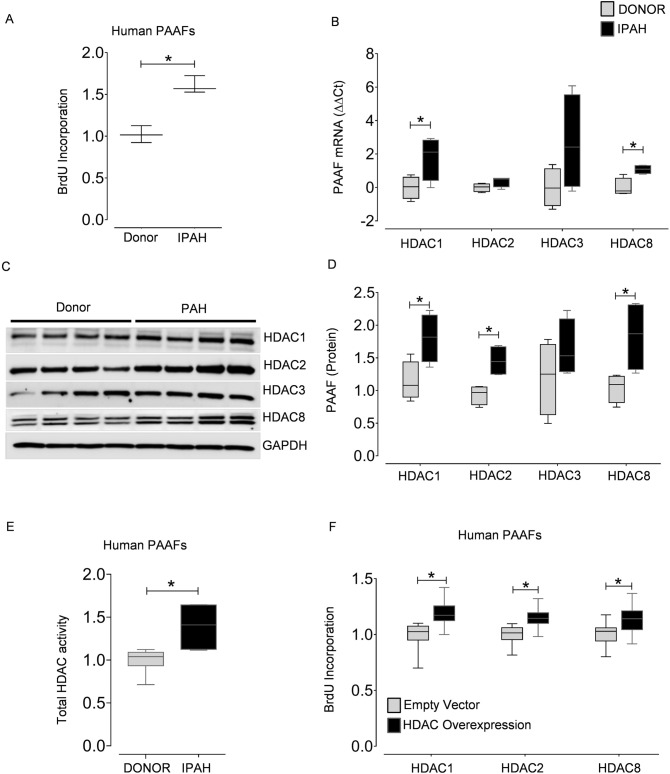
Class I HDAC isoforms are overexpressed in PAH and are associated with adventitial fibroblast proliferation. Cell proliferation was assessed by BrdU incorporation in (A) donor- and IPAH-PAAFs (n = 3) cultured ex vivo. Data was normalized to respective donors. (B) qPCR analysis of HDACs was performed on the RNA isolated from the PAAFs harvested from healthy donors (n = 4) and PAH (n = 4) patients. ∆Ct values were normalized to β-2 microglobulin (β2M) and further normalized (∆∆Ct) to donor controls. (C) Western blots were performed on lysates extracted from human PAAFs of healthy donors (n = 4) and PAH (n = 4) patients. (D) Blots were quantified by densitometry and are represented as box plots after normalization to internal loading control. (E) HDAC activity (OD/min/mg) was measured in PAAFs harvested from healthy donors (n = 3) and PAH (n = 3) patients using colorimetric assay kit (Epigenase HDAC Activity/Inhibition Assay Kit, Epigentek). (F) Overexpression of HDACs was achieved by transient transfection of donor-PAAFs (n = 3) with validated HDAC1, HDAC2, HDAC8 plasmids, and their functional effects on proliferation was assessed by BrdU incorporation, 48 hours (h) post-transfection. Empty vector plasmid was used as negative control. Data was normalized to untransfected cells. In all plots, significant differences between corresponding comparisons are indicated as *p < 0.05, Student's t-test.

Acknowledgments
This image is the copyrighted work of the attributed author or publisher, and ZFIN has permission only to display this image to its users. Additional permissions should be obtained from the applicable author or publisher of the image. Full text @ Sci. Rep.