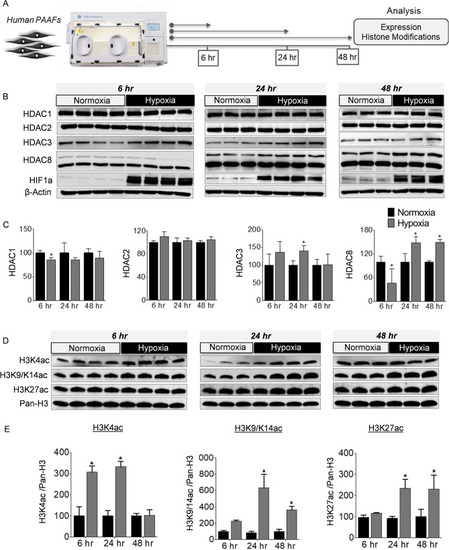
Regulation of class I HDACs and histone modifications by hypoxia ex vivo. (A) Schematic representation of the experimental plan to study the regulation of HDAC expression and dynamic changes in histone acetylation levels in donor-PAAFs (n ≥ 3) exposed to hypoxia. (B) Western blots were performed on proteins extracted from human donor-PAAFs exposed to hypoxia. (C) Blots were quantified by densitometry and are represented as bar charts after normalization to internal loading control, β-actin. For HDAC8, both the upper (Fig. 6) and lower bands (in Fig. S3) were quantified separately. (D) To determine the effect of hypoxia exposure on histone modifications, western blot analysis was performed on extracts from donor-PAAFs exposed to hypoxia with antibodies raised against specific post-translational modification of histones associated with transcription activation (H3K4ac; H3K9/K14ac) and active enhancers (H3K27ac). (E) Blots were quantified by densitometric analysis and are represented as bar charts after normalization to internal loading control (Pan-histone H3). Significant differences found in comparison between the treatment (hypoxia) and control groups (normoxia) are indicated by an asterisk symbol (*p < 0.05, Two-way ANOVA with Bonferroni post-tests for multiple comparisons). K-Lysine, ac acetylation.
|
