FIGURE SUMMARY
Title

Srag regulates autophagy via integrating into a preexisting autophagy pathway in testis

Authors
Cheng, Y., Lai, F., Wang, X., Shang, D., Zou, J., Luo, M., Xia, X., Cheng, H., Zhou, R.
Source
Full text @ Mol Bio Evol

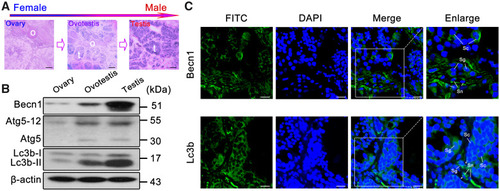
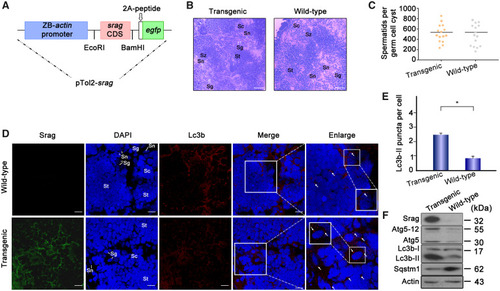
Upregulation of autophagy in testis. (A) H&E staining of the gonad tissues in Monopterus albus. The gonad transforms from ovary (o) to testis (t) via ovotestis during sex reversal. Scale bar: 100 μm. (B) Western blot analysis showed that Becn1, Atg5–Atg12, and Lc3b-II were upregulated during gonad transition. β-Actin was used as an internal control. (C) Immunofluorescence of the Lc3b and Becn1 proteins in testis using the anti-LC3B and anti-BECN1 antibodies followed by FITC-conjugated ImmunoPure goat anti-rabbit IgG (green). Lc3b was mainly expressed in the cytoplasm of Sertoli cells (Sn), spermatogonia (Sg), and spermatocytes (Sc) in testis. Lc3b-II puncta were detected in Sertoli cells and spermatogonia in testis (white arrows). Becn1 was expressed in Sertoli cells, spermatogonia, and spermatocytes in testis. The nuclei were revealed using DAPI fluorescence (blue). Images were captured using confocal microscopy. The enlarged images originated from the white squares. Scale bar: 10 μm.

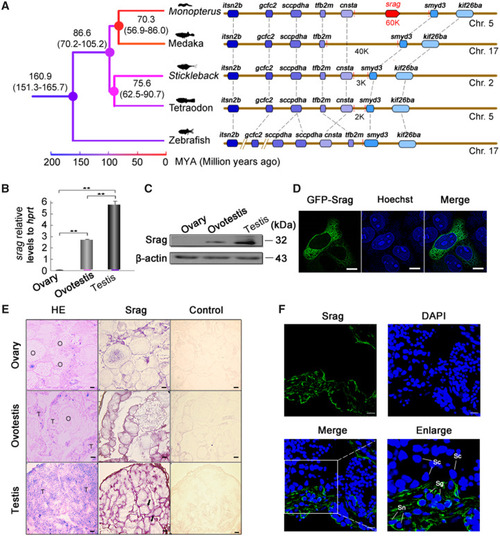
Identification and expression of srag in testis. (A) Synteny analysis. New gene srag in the genome of Monopterus has not any homologous genomic region in other teleost species. srag is a new gene on chromosome 5 of Monopterus; other genes on the chromosome are syntenic and conserved between Monopterus and other fishes (medaka, stickleback, tetraodon, and zebrafish). The number on the nodes indicates the time ranges of divergence from the present (Ma). (B) Quantitative real-time PCR of srag in gonads of Monopterus. Total RNA samples were isolated from ovary, ovotestis, and testis of adult individuals. srag mRNA expression was upregulated from ovary to testis. hprt was used as an internal control. (C) Western blot analysis showed Srag protein levels in different gonads using the anti-Srag antibody. β-Actin was used as an internal control. (D) Srag was expressed in the cytoplasm of HeLa cells after transfection. Images were captured using confocal microscopy. The nuclei were revealed using Hoechst fluorescence (blue). Scale bar: 5 μm. (E) Expression analysis of srag by mRNA in situ hybridization on gonad sections in adult individuals. Positive signals were observed in peripheral region of seminiferous epithelium (arrows). H&E staining indicates tissue structure of gonads. Labeled sense-strand DNA was used as a control. Scale bar: 50 μm. (F) Immunofluorescent localization of Srag protein in gonads using anti-Srag antibody followed by FITC-conjugated ImmunoPure goat anti-rabbit IgG (green). Srag was expressed in the cytoplasm of Sertoli cells (Sn) and spermatogonia (Sg) in testis. The nuclei were stained by DAPI (blue). Images were captured using confocal microscopy. The enlarged images originated from the regions with white squares. Scale bar: 10 μm.

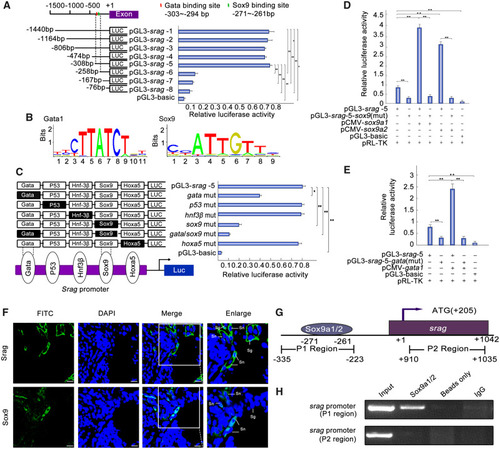
Sox9a1/2 and Gata1 upregulates srag promoter activity. (A) Luciferase assay indicated the activities of a series of truncated srag promoters in 293T cells. Endogenous SOX9 is expressed in 293T cells. Left panel showed each truncated mutant linked with the luciferase gene in the pGL3-basic vector. Binding sites of Gata and Sox9 were indicated in red and green bars, respectively. Right panel indicated the relative activities of these constructs, as determined by luciferase assays. (B) Sequence logo of Sox9- and Gata1-binding sites based on JASPAR database. (C) Point mutation analysis of the promoter using luciferase assays. The pGL3-srag-5 of 308 bp was used as a template for the point mutation analysis. Luciferase assays were used to determine the relative activities. The intact binding sites of the Gata, P53, Hnf3β, Sox9, and Hoxa5 are indicated by open boxes, respectively. The filled boxes show the corresponding mutations. The pGL3-basic vector was used as a negative control. (D) Sox9a1/2 overexpression upregulated the luciferase activity of srag promoter. Sox9a1/2 transfection activated the srag promoter. In total, 0.32 μg pGL3-srag-5 or its Sox9-binding site mutant (pGL3-srag-5-sox9(mut)) was cotransfected with 0.08 μg sox9a1/2 expression plasmids (pCMV-sox9a1 and pCMV-sox9a2), as indicated. Sox9a1 and Sox9a2 overexpression increased the activity of pGL3-srag-5 but did not affect the activity of pGL3-srag-5-sox9(mut). (E) Gata1 overexpression upregulated the luciferase activity of srag promoter. Gata1 transfection activated the srag promoter. In total, 0.32 μg pGL3-srag-5 or its Gata-binding site mutant (pGL3-srag-5-gata (mut)) was cotransfected with 0.08 μg Gata1 expression plasmids (pCMV-gata1). Gata1 overexpression increased the activity of pGL3-srag-5, but did not affect the activity of pGL3-srag-5-gata (mut). (F) Coexpression analysis between Srag and Sox9. Immunofluorescence of testis samples in serial sections using anti-Srag or anti-Sox9 antibody followed by FITC-conjugated ImmunoPure goat anti-rabbit IgG (green). Sox9 was expressed in the nuclei of Sertoli cells (Sn) in testis, and Srag was detected mainly in the cytoplasm of Sertoli cells (Sn) and spermatogonia (Sg). The nuclei were stained by DAPI (blue). Images were captured using confocal microscopy. The enlarged images originated from the regions with white squares. Scale bar: 10 μm. (G) Schematic diagram of primer relative positions in the ChIP assays. (H) ChIP assays. ChIP analysis showed that Sox9 could bind to the srag promoter in vivo. Sonicated chromatin from testis of the adult individuals was used for PCR amplification. A 112-bp fragment corresponding to the −335 to −223 region of the srag promoter was amplified using the immunoprecipitated DNA as a template which was immunoprecipitated with monoclonal anti-Sox9. In controls (no antibody [beads only] or preimmune IgG), no band from the anti-Sox9 antibody precipitates was observed. Exon of srag was used as a negative control. The means ± SD are from three independent experiments. One-way ANOVA was performed. *P < 0.05; **P < 0.01.

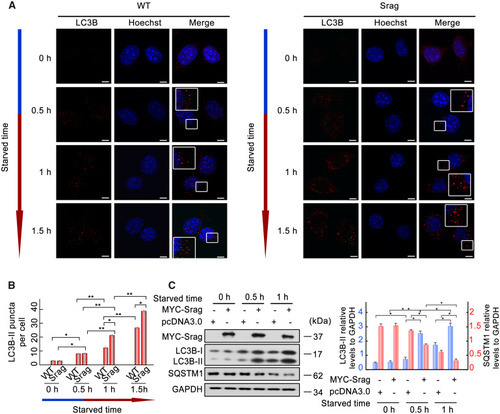
Srag overexpression promotes autophagy upon starvation induction. (A) Srag overexpression upregulated number of LC3B-II puncta. LC3B-II puncta were detected in wild-type or Srag overexpression HeLa cells cultured in the HBSS (Hanks balanced salt solution) medium for 0, 0.5, 1, and 1.5 h, respectively. Immunofluorescence was analyzed with anti-LC3B antibody and followed by confocal microscopy. LC3B-II puncta were detected in the cytoplasm by TRITC-conjugated ImmunoPure goat anti-rabbit IgG (red). The nuclei were revealed using Hoechst fluorescence. Enlarged boxes highlight LC3B-II signals. Scale bar: 5 μm. (B) Statistics of the LC3B-II puncta. The number of LC3B-II puncta was quantified from ∼20 cells for each group. The means ± SD are from three independent experiments. One-way ANOVA was performed. *P < 0.05; **P < 0.01. (n = 3 independent experiments). (C) srag overexpression upregulates LC3B-II level under starvation condition. HEK293T cells were transfected with equal amount of MYC-Srag or vector pcDNA3.0 (control) and cultured in the EBSS (Earle’s balanced salts solution) medium for 0, 0.5 and 1 h, respectively. Western blot analysis indicated that LC3B-II is upregulated by Srag overexpression in a time-dependent manner under starvation condition, whereas its downstream substrate SQSTM1 was downregulated. Cell lysates were analyzed by western blotting with the anti-LC3B and anti-MYC antibodies. GAPDH was used as an internal control. Western blots were quantified for LC3B-II/GAPDH and SQSTM1/GAPDH ratio. Data are presented as means ± SD. *P < 0.05; **P < 0.01 (n = 3 independent experiments).

srag transgenic zebrafish analysis. (A) Schematic depiction of the pTol2-srag-egfp transgenic construct. The transgenic structure contains a region of the zebrafish actin promoter linked with the srag CDS (coding DNA sequence), a gfp tag, and 2A peptide cloned into the pTol2 vector. (B) Histological analysis of adult testis samples of srag transgenic and wild-type zebrafish by H&E staining. The white arrows indicate spermatogonia (sg) and Sertoli cells (sn). Scale bar: 50 μm. (C) Spermatid number in germ cell cyst in testis between srag transgenic and wild-type zebrafish (P < 0.9). (D) Immunofluorescence analysis of testis samples in both transgenic and wild-type zebrafish using anti-LC3B antibody. Images were captured using confocal microscopy. Lc3b-II puncta were obviously increased in the srag transgenic testis in comparison with wild type in spermatids (St), spermatocytes (Sc), and spermatogonia (Sg). The nuclei were stained by DAPI (blue). The enlarged images on the right panels originated from the white squares, the white arrows indicate Lc3-II puncta in spermatocytes (Sc). Enlarged box within the image highlights Lc3b-II puncta in Sertoli cells (Sn). Scale bar: 10 μm. (E) The number of Lc3b-II puncta was quantified from ∼20 cells for each group from (D). Data were presented as means ± SD. T-test was performed, *P < 0.05; **P < 0.01 (n = 3 independent experiments). (F) Western blot analysis of testis samples in both srag transgenic and wild-type zebrafish. Srag protein was detected in transgenic testis but not in wild type using the anti-Srag antibody. β-Actin was used as a control. Western blot analysis indicated that Lc3b-II and Atg5-Atg12 were upregulated, whereas Sqstm1 was downregulated in testis of transgenic zebrafish.

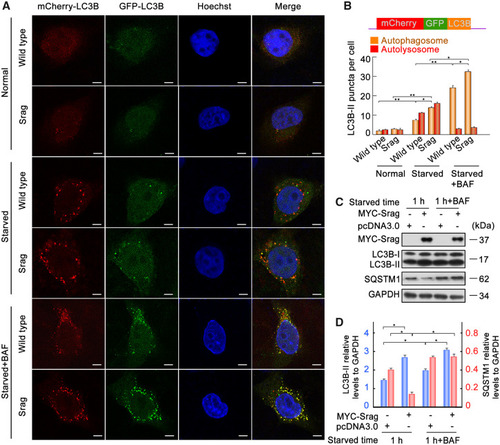
Srag-associated autophagy flux. (A) srag overexpressed and wild-type HeLa cells were transfected with the mCherry-GFP-LC3B tandem reporter. The cells were cultured in normal (control), EBSS medium (1 h), or EBSS with bafilomycin A1 (100 nM) addition (1 h), respectively. Single channel (red, green, or blue) and merged images were taken by confocal microscopy. (B) Statistic analysis of vesicles positive for both GFP and mCherry (autophagosomes) and for mCherry (autolysosomes) (>15 cells per experiment). Colocalized dots were counted. Data are presented as means ± SD. *P < 0.05, **P < 0.01 (n = 3 independent experiments). (C, D) srag overexpression promoted LC3B-II formation. Bafilomycin A1 treatment resulted in protein accumulation of LC3B-II. srag overexpression and control HEK293T cells were cultured and then starved in EBSS with or without bafilomycin A1 (100 nM) for 1 h. The cell lysates were analyzed by immunoblotting with the anti-LC3B, anti-SQSTM1, and anti-MYC antibodies. GAPDH was used as an internal control. (D) Western blots were quantified for LC3B-II/GAPDH and SQSTM1/GAPDH ratio. Data are presented as means ± SD. One-way ANOVA was performed, *P < 0.05; **P < 0.01 (n = 3 independent experiments).

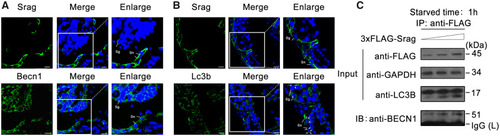
Srag coexpression with Becn1 and Lc3b and interaction between Srag and Becn1. (A, B) Coexpression analysis of Srag with Lc3b and Becn1. Immunofluorescence analysis of testis samples in serial sections using anti-Lc3b, anti-Srag, or anti-Becn1 antibody, respectively, then followed by FITC-conjugated ImmunoPure goat anti-rabbit IgG (green). The coexpression signals were detected in the cytoplasm of Sertoli cells (Sn) and spermatogonia (Sg) in testis. Lc3b-II puncta were detected in Sertoli cells and spermatogonia in testis (white arrows). The nuclei were stained by DAPI (blue). Images were captured using confocal microscopy. The enlarged images originated from the regions with white squares. Scale bar: 10 μm. (C) LC3B-II upregulation by srag overexpression and Co-IP between Srag and BECN1. HEK293T cells were transfected with an increasing amount of 3xFLAG-Srag (0, 0.5, and 1 μg). pcDNA3.0 was added for an equal amount DNA in each well. Western blot analysis indicated that LC3B-II is upregulated by Srag overexpression in a dose-dependent manner under starvation condition. Co-IP analysis indicated interaction between Srag and BECN1. Cell lysates were analyzed by western blotting with the anti-LC3B and anti-FLAG antibodies. GAPDH was used as an internal control.

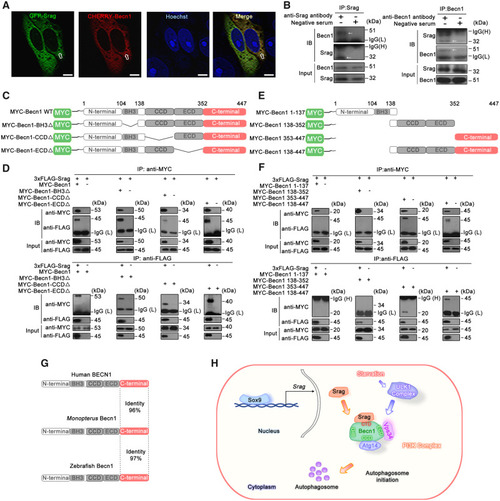
Srag interacts with Becn1. (A) Colocalization analysis between Srag and Becn1. HeLa cells were transiently cotransfected with GFP-Srag and mCherry-Becn1, followed by confocal microscopy. Colocalizing structures were indicated in yellow (merge). Arrows indicated the signals overlapped between Srag and Becn1. The nuclei were revealed using Hoechst fluorescence. Scale bar: 5 μm. (B) Co-IP analysis between endogenous Srag and Becn1 in testis of the adult Monopterus. The lysates were immunoprecipitated with anti-Srag, anti-Becn1 antibody, or negative serum, respectively, followed by immunoblotting with the anti-Becn1 or anti-Srag antibody, respectively. Arrows indicated the Co-IP band. (C) Schematic diagram of the Monopterus Becn1 wild-type and various deletions. The conserved domains (BH3, CCD, ECD, and C-terminal) are indicated in boxes. (D) Co-IP between Srag and deletion mutants of Becn1. 293T cells were transiently cotransfected with 3xFLAG-Srag and MYC-Becn1, MYC-Becn1-BH3Δ, MYC-Becn1-CCDΔ, or MYC-Becn1-ECDΔ. After transfection for 48 h, the whole-cell lysates were extracted for Co-IP with anti-FLAG or anti-MYC antibody, and anti-MYC or anti-FLAG antibody was used for western blot, respectively. The cell lysates were examined by western blotting using the anti-MYC or anti-FLAG antibody (input). (E) Schematic diagram of the Monopterus Becn1 truncated mutants. The conserved domains (BH3, CCD, ECD, and C-terminal) are indicated in boxes. (F) Co-IP analysis showed that Srag interacted with the C terminus of Becn1. 3xFLAG-Srag was cotransfected with MYC-Becn1 1–137, MYC-Becn1 138–352, MYC-Becn1 353–447, and MYC-Becn1 138–447 into 293T cells. The cell lysates were examined by western blotting using the anti-MYC or anti-FLAG antibody (input). The lysates were immunoprecipitated with the anti-FLAG or anti-MYC antibody, followed by immunoblotting with anti-MYC and anti-FLAG antibody, respectively. 3xFLAG-Srag can interact with MYC-Becn1 353–447 and MYC-Becn1 138–447. (G) Sequence alignments of the conserved C-terminal (pink) of BECN1 in human, Monopterus, and zebrafish. (H) Sox9–Srag–Becn1 pathway in autophagy regulation. srag promoter activity is activated by its transcription factor Sox9, which is bound to the srag promoter region in vivo. Srag interacts with the C-terminal of Becn1 to promote autophagy via PI3K complex upon starvation induction.

Acknowledgments
This image is the copyrighted work of the attributed author or publisher, and ZFIN has permission only to display this image to its users. Additional permissions should be obtained from the applicable author or publisher of the image. Full text @ Mol Bio Evol