IMAGE

FIG. 6.

ID
ZDB-IMAGE-210113-98
Source
Figures for Cheng et al., 2020
Image
Figure Caption

FIG. 6.

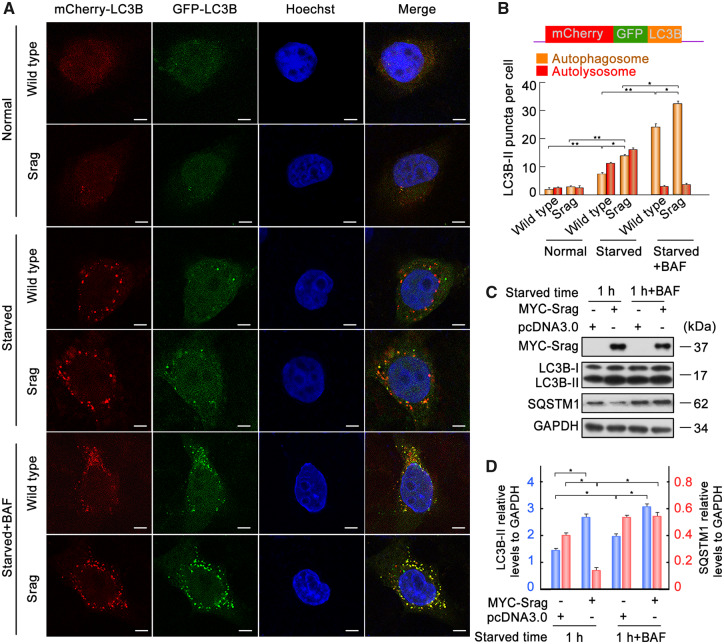
Srag-associated autophagy flux. (A) srag overexpressed and wild-type HeLa cells were transfected with the mCherry-GFP-LC3B tandem reporter. The cells were cultured in normal (control), EBSS medium (1 h), or EBSS with bafilomycin A1 (100 nM) addition (1 h), respectively. Single channel (red, green, or blue) and merged images were taken by confocal microscopy. (B) Statistic analysis of vesicles positive for both GFP and mCherry (autophagosomes) and for mCherry (autolysosomes) (>15 cells per experiment). Colocalized dots were counted. Data are presented as means ± SD. *P < 0.05, **P < 0.01 (n = 3 independent experiments). (C, D) srag overexpression promoted LC3B-II formation. Bafilomycin A1 treatment resulted in protein accumulation of LC3B-II. srag overexpression and control HEK293T cells were cultured and then starved in EBSS with or without bafilomycin A1 (100 nM) for 1 h. The cell lysates were analyzed by immunoblotting with the anti-LC3B, anti-SQSTM1, and anti-MYC antibodies. GAPDH was used as an internal control. (D) Western blots were quantified for LC3B-II/GAPDH and SQSTM1/GAPDH ratio. Data are presented as means ± SD. One-way ANOVA was performed, *P < 0.05; **P < 0.01 (n = 3 independent experiments).

Acknowledgments
This image is the copyrighted work of the attributed author or publisher, and ZFIN has permission only to display this image to its users. Additional permissions should be obtained from the applicable author or publisher of the image. Full text @ Mol Bio Evol