
- Title
-
Infant and adult SCA13 mutations differentially affect Purkinje cell excitability, maturation, and viability in vivo
- Authors
- Hsieh, J.Y., Ulrich, B.N., Issa, F.A., Lin, M.A., Brown, B., Papazian, D.M.
- Source
- Full text @ Elife

Wild-type zebrafish Kv3.3a, iR4H, or a 1:1 mixture of wild type and iR4H RNAs were expressed in |
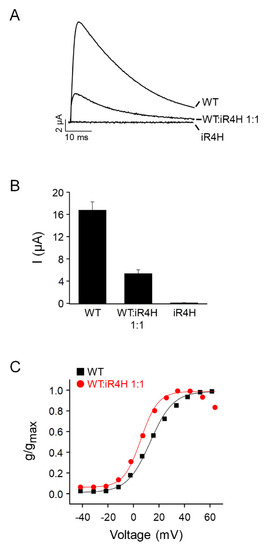
Wild-type zebrafish Kv3.3a, iR4H, or a 1:1 mixture of wild type and iR4H RNAs were expressed in |
( |

Data are the same as shown in |
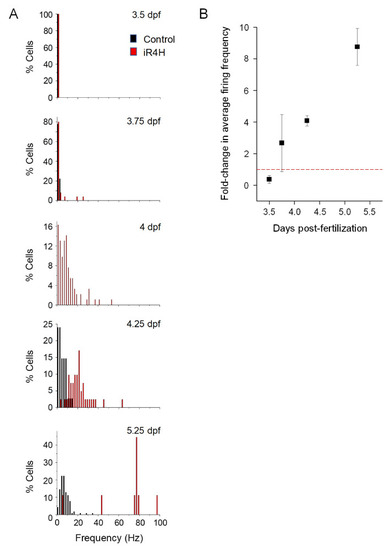
Histograms show the percentage of cells with the indicated average firing frequencies in 2 Hz bins at different times postfertilization. Black bars, control cells. Red bars, aR3H-expressing cells. Data are the same as shown in |

Histograms show the percentage of cells with the indicated average firing frequencies in 2 Hz bins at different times postfertilization. Black bars, control cells. Red bars, aR3H-expressing cells. Data are the same as shown in |

( |

( |
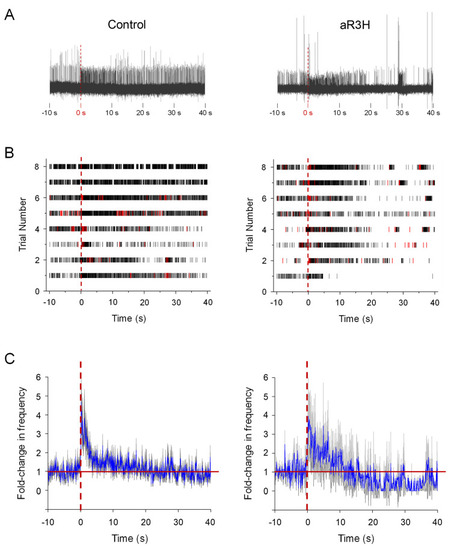
At 5 dpf, live zebrafish were adapted to a LED light, which was turned off at time 0 s ( |

Live images of a Purkinje cell expressing exogenous wild type Kv3.3 were acquired during cerebellar development in vivo using a laser scanning confocal microscope at different times post-fertilization as indicated. Maximum intensity projections of stacks of 1 μm optical sections are shown. Scale bar: 10 μm. |

Live images of a Purkinje cell expressing exogenous wild type Kv3.3 were acquired during cerebellar development in vivo using a laser scanning confocal microscope at different times post-fertilization as indicated. Maximum intensity projections of stacks of 1 μm optical sections are shown. Scale bar: 10 μm. |

( |

( |
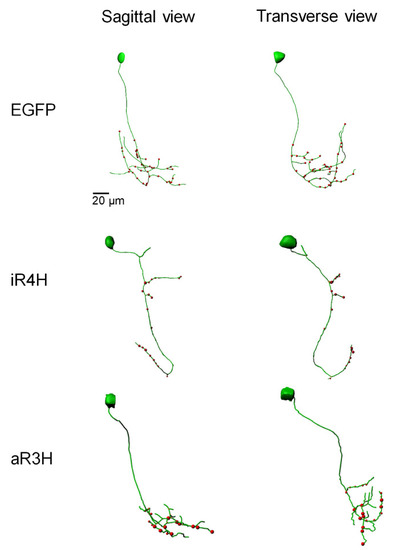
Representative confocal image stacks of CaP neurons expressing EGFP, or EGFP fusion proteins of iR4H or aR3H were traced using Imaris software. Projected traces are shown from sagittal and transverse perspectives. Red dots indicate presynaptic specializations labeled by a co-expressed synaptophysin-mCherry fusion protein. |

( |

( |