
Image
|
Figure Caption
Figure 2—figure supplement 1.
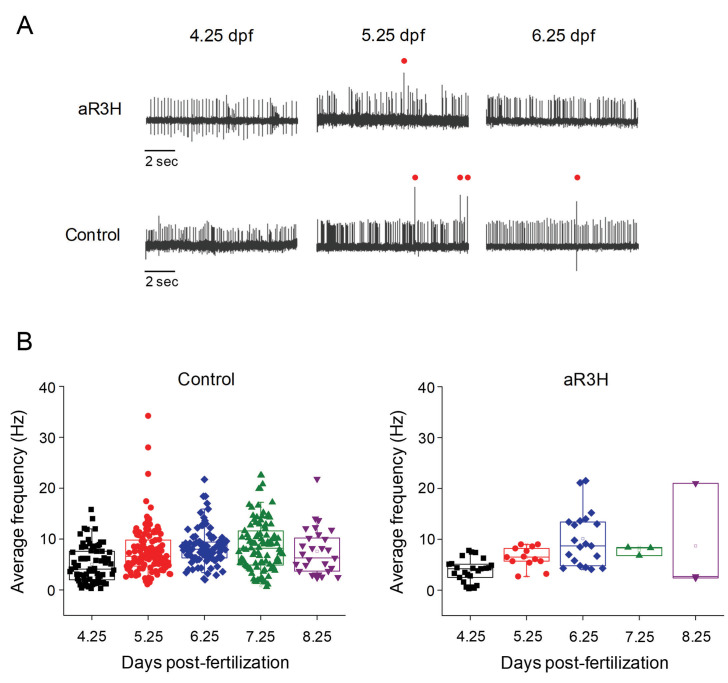
Histograms show the percentage of cells with the indicated average firing frequencies in 2 Hz bins at different times postfertilization. Black bars, control cells. Red bars, aR3H-expressing cells. Data are the same as shown in
Acknowledgments
This image is the copyrighted work of the attributed author or publisher, and
ZFIN has permission only to display this image to its users.
Additional permissions should be obtained from the applicable author or publisher of the image.
Full text @ Elife