
Figure 3.
- ID
- ZDB-FIG-200731-10
- Publication
- Hsieh et al., 2020 - Infant and adult SCA13 mutations differentially affect Purkinje cell excitability, maturation, and viability in vivo
- Other Figures
-
- Figure 1—figure supplement 1.
- Figure 1—figure supplement 1.
- Figure 1—figure supplement 2.
- Figure 1—figure supplement 3.
- Figure 2—figure supplement 1.
- Figure 2—figure supplement 1.
- Figure 2—figure supplement 2.
- Figure 2—figure supplement 3.
- Figure 3.
- Figure 4—figure supplement 1.
- Figure 4—figure supplement 1.
- Figure 5—figure supplement 1.
- Figure 5—figure supplement 1.
- Figure 5—figure supplement 2.
- Figure 6—figure supplement 1.
- Figure 6—figure supplement 1.
- All Figure Page
- Back to All Figure Page
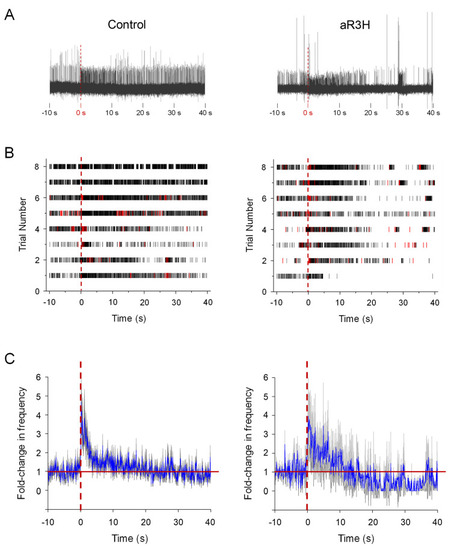
At 5 dpf, live zebrafish were adapted to a LED light, which was turned off at time 0 s ( |