Di Martile, M., Gabellini, C., Desideri, M., Matraxia, M., Farini, V., Valentini, E., Carradori, S., Ercolani, C., Buglioni, S., Secci, D., Andreazzoli, M., Del Bufalo, D., Trisciuoglio, D.
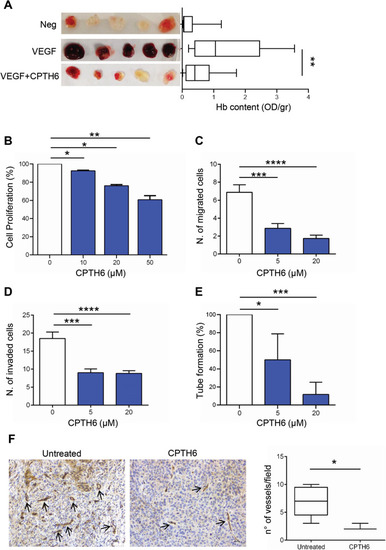
a Representative images of matrigel plugs and hemoglobin content of in vivo vessel formation assessed after injection of C57BL/6 mice with matrigel plugs containing PBS (Negative control), VEGF alone (Positive control) or VEGF in combination with 50 μM CPTH6. Five matrigel plugs/group of a representative experiment are shown. The values were expressed as optical density (OD)/gr matrigel plug. p-values were calculated between positive and CPTH6-containing matrigel plugs. b Analysis of proliferation of HUVEC exposed to increasing concentrations of CPTH6 for 72 h. The results are reported as percentage of “proliferation of CPTH6-treated cells/proliferation of control cells”. The results represent the average ± SD of three independent experiments. c,d Quantification of in vitro cell migration (c) and cell invasion (d) of HUVEC exposed to the indicated concentrations of CPTH6 for 6 h. The results are reported as average ± SD of number of migrated or invaded cells. e Quantification of capillary-like structure formation in HUVEC exposed to the indicated concentrations of CPTH6 for 6 h. The results are reported as percentage of tube formation relative to control, and represent the average ± SD of three independent experiments. f Representative images and relative quantification of immunohistochemical detection of microvessel density by CD31 staining in LCSC136 tumors from control or CPTH6-treated mice. NOD/SCID mice inoculated subcutaneously with 2.5 × 10⁵ LCSC136 cells and treated intraperitoneally with CPTH6 (50 mg/Kg; 5 days every 24 h for 3 weeks), IHC analysis was performed at the end of treatment. Magnification 20X. Scale bar, 30 μm. b-fp-values were calculated between control and treated cells. *p < 0.05; **p < 0.01; ***p < 0.001; ****p < 0.0001.
a Western blot analysis and relative quantification by densitometric analysis of total or acetylated histone H3 pan (Ac-H3) or at K9 (Ac-H3K9), K27 (Ac-H3K27), K56 (Ac-H3K56), and histone H4 at K16 (Ac-H4K16) and α-tubulin at K40 (Ac-tubulin) in extract of HUVEC exposed to indicated concentrations of CPTH6 for 72 h. Values are expressed as fold change of acetylated proteins relative to total ones. b Immunofluorescence images (left) and relative quantification (right) of tyrosinated (Tyr) and acetylated (Ac) α-tubulin in HUVEC exposed to increasing concentrations of CPTH6 for 72 h. p-values were calculated between control and treated cells. *p < 0.05. Magnification 63X. Scale bar, 50μm
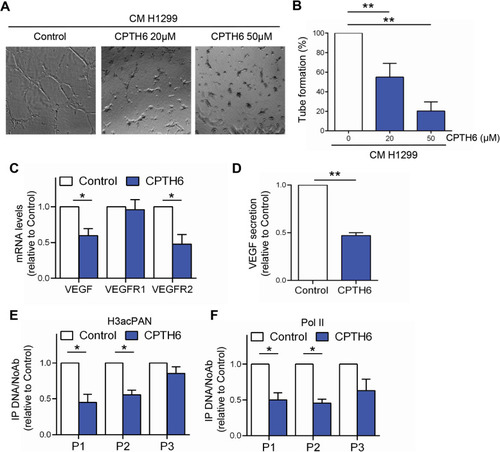
a Representative images and b relative quantification of morphogenesis assay of HUVEC plated on matrigel exposed for 6 h to the conditioned media (CM) from control or H1299 cells treated with CPTH6 for 24 h at the indicated concentrations. c Analysis of VEGF, VEGFR1 and VEGFR2 mRNA expression in H1299 cells exposed to 20 μM CPTH6 for 24 h. d Quantification of VEGF protein secretion performed by ELISA assay in CM from H1299 control cells or treated as reported in (c). e,f ChIP analysis of (e) histone H3 acetylation (H3acPAN) and (f) Pol II recruitment at three regions (P1-P3) of VEGF promoter of H1299 control cells or treated as in (c). The results represent the average ± SD (b,d) or ± SEM (c,e,f) of three independent experiments. p values were calculated between control and treated conditioned medium (a,b,d) or between control and treated cells (c,e,f). *p < 0.05. **p < 0.01
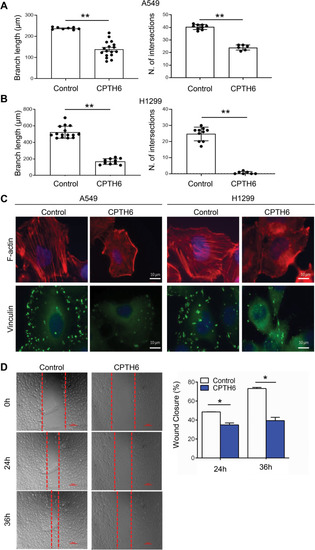
a,b Quantification (branch length and number of intersection points) of capillary-like structure formation in A549 (a) and H1299 (b) cells plated on matrigel and treated with 20 μM CPTH6 for 18 h. The results represent the average ± SD of two independent experiments. c Representative images of immunofluorescence conducted in A549 and H1299 cells control or treated with 50 μM CPTH6 for 24 h using rhodamine-conjugated phalloidin to visualize F-actin fibers or for vinculin expression and localization. Blue fluorescence represents DAPI stained nuclei. d Representative images and relative quantification of migration of A549 cells control or treated with 50 μM CPTH6 for 48 h and subjected to time-lapse videorecording. The images were recorded every 15 min, and were taken at the starting point (0 h), after 24 and 36 h. The red outlines show the gap area. The migration rates of two different conditions (control and CPTH6) were determined as the percentage of wound closure or the percentage of area reduction. Magnification 10X. Scale bar, 100 μm. a, b, d p values were calculated between control and CPTH6-treated cells. *p < 0.05; **p < 0.01
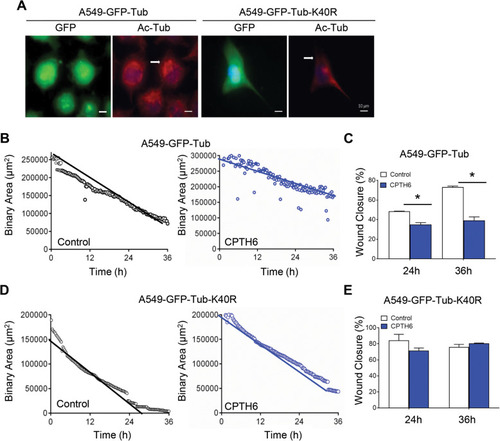
a Representative images of immunofluorescence for DNA (blue), GFP (green), and acetylated α-tubulin (red) of A549 cells overexpressing α-tubulin WT-GFP (A549-GFP-Tub) or α-tubulin K40R-GFP (A549-GFP-Tub-K40R). Scale bar, 10 μm. b-e Quantification of migration rate of A549 cells (b) overexpressing α-tubulin WT-GFP, and (d) α-tubulin K40R-GFP treated with CPTH6 for 48 h and subjected to time-lapse videorecording using a 10X objective. The sheet migration rates of two different conditions (control and CPTH6-treated) were determined by plotting the binary area versus time. c,e The migration rates of A549 cells (c) overexpressing α-tubulin WT-GFP and (e) α-tubulin K40R-GFP in response to CPTH6 were determined as the percentage of wound closure. p values were calculated between control and treated cells. *p < 0.05
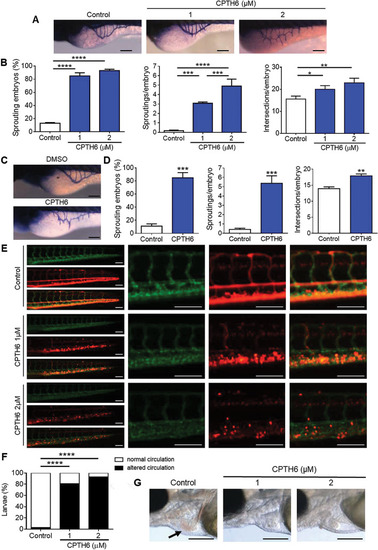
a Representative images and b quantification of subintestinal veins (SIVs) development alteration, evidenced by whole-mount alkaline phosphatase staining in Casper zebrafish embryos at 72 hpf exposed to 1 and 2 μM CPTH6 at 6 hpf. c Representative images and (d) quantification of SIVs development alteration evidenced by whole-mount alkaline phosphatase staining in Casper zebrafish embryos at 72 hpf injected in the yolk with 50 μM CPTH6 solution at 48 hpf. b,d Development alteration was evaluated in terms of sprouting embryos (100%), sproutings/embryo, intersections/embryo. The error bar represents the standard error of the mean (SEM) of 3 independent experiments (N = 75 larvae/experiment). e Representative images of GFP-positive ISVs development and Dsred-positive erythroid cells and f percentage of larvae with altered circulation in Tg (kdrl: GFP;gata1:dsRed) Casper zebrafish at 72 hpf exposed to 1 and 2 μM CPTH6 at 6 hpf. At higher magnification the accumulation of gata1-positive erythroid cells is evidenced in caudal erythropoietic tissue of CPTH6-treated embryos. f A representative experiment of 4 independent experiments (n = 30–40 larvae/experiment) with the same result is shown. g Bright-field micrographs of Casper zebrafish larvae at 96 hpf exposed to 1 and 2 μM CPTH6 at 6 hpf. Arrow indicates the normal color of blood. Scale bar, 200 μm. a-g As control, zebrafish larvae were exposed to DMSO solution. b,d,f *p < 0.05, **p < 0.01, ***p < 0.001, ****p < 0.0001. (a, c, e) Scale bar, 100 μm
Acknowledgments
This image is the copyrighted work of the attributed author or publisher, and
ZFIN has permission only to display this image to its users.
Additional permissions should be obtained from the applicable author or publisher of the image.
Full text @ J. Exp. Clin. Cancer Res.
Your Input Welcome
Thank you for submitting comments. Your input has been emailed to ZFIN curators who may contact you if
additional information is required.
Oops. Something went wrong. Please try again later.