|
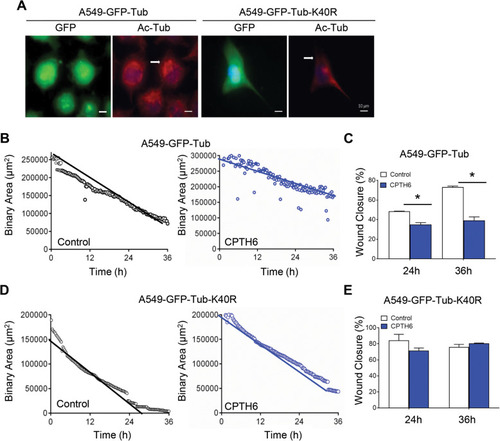
a Representative images of immunofluorescence for DNA (blue), GFP (green), and acetylated α-tubulin (red) of A549 cells overexpressing α-tubulin WT-GFP (A549-GFP-Tub) or α-tubulin K40R-GFP (A549-GFP-Tub-K40R). Scale bar, 10 μm. b-e Quantification of migration rate of A549 cells (b) overexpressing α-tubulin WT-GFP, and (d) α-tubulin K40R-GFP treated with CPTH6 for 48 h and subjected to time-lapse videorecording using a 10X objective. The sheet migration rates of two different conditions (control and CPTH6-treated) were determined by plotting the binary area versus time. c,e The migration rates of A549 cells (c) overexpressing α-tubulin WT-GFP and (e) α-tubulin K40R-GFP in response to CPTH6 were determined as the percentage of wound closure. p values were calculated between control and treated cells. *p < 0.05
|