
- Title
-
A zebrafish model for HAX1-associated congenital neutropenia
- Authors
- Doll, L., Aghaallaei, N., Dick, A.M., Welte, K., Skokowa, J., Bajoghli, B.
- Source
- Full text @ Haematologica
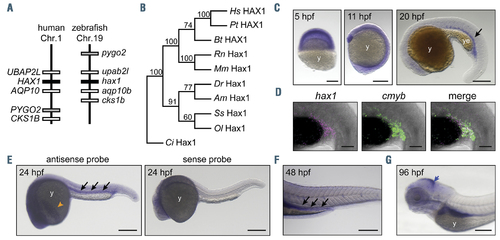
Characterization of zebrafish hax1. (A) Schematic comparison showing syntenic conservation of the hax1 loci in humans and zebrafish. (B) A neighbor-joining phylogenetic tree of Hax1 proteins, which was performed with 1,000 bootstrap replications. Am, Astyanax mexicanus; Bt, Bos taurus; Ci, Ciona intestinalis; Dr, Danio rerio; Hs, Homo sapiens; Mm, Mus musculus; Ol, Oryzias latipes; Pt, Pan troglodytes; Rn, Rattus norvegicus; Ss, Salmo salar. (C) Spatial hax1 expression by whole mount in situ hybridization analysis from 5 to 20 hours post-fertilization (hpf). (D) Confocal image of double fluorescent in situ hybridization of hax1 (magenta) and cmyb (green) at 20 hpf. (E-G) Spatial hax1 expression at 24 (E), 48 (F) and 96 (G) hpf. Arrows in C, E, and F indicate hax1 expression in the hematopoietic site. A sense probe was used as a negative control (E, right panel). Note that the images shown in E are two images stitched together. y: yolk; ye: yolk extension. Scale bars: 100 mm (C, E-G), 50 mm (D). EXPRESSION / LABELING:
|
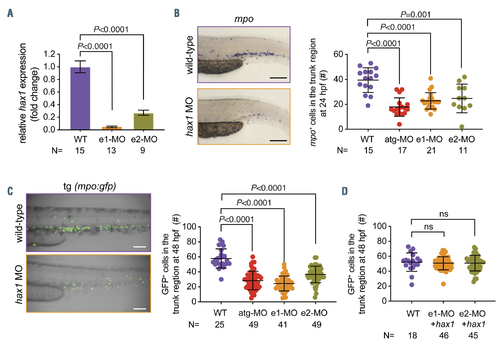
Knockdown of hax1 impairs neutrophil development. (A) Relative change of wild-type hax1 transcript in the hax1 morphants compared with wild-type (WT) using quantitative polymerase chain reaction. N indicates number of biological replicates. (B) Representative images of mpo-stained cells in WT and e1-MO injected embryos (left panel). Note that each stained cell represents a neutrophil. The right panel shows numbers of mpo stained cells in the trunk region at 24 hours postfertilization (hpf). (C) Injection of hax1 morpholinos (MO) in the tg(mpo:gfp) line. The left panel shows representative images of uninjected (WT) and hax1 e1-MO injected transgenic embryos at 48 hpf. The right panel shows numbers of green fluorescent protein-positive cells in the trunk region. (D) Co-injection of e1-MO or e2- MO morpholinos with hax1 mRNA rescued the reduced neutrophil numbers in the tg(mpo:gfp) line. Scale bars indicate 100 mm. Each dot represents an individual embryo. Data are means } standard deviation. |
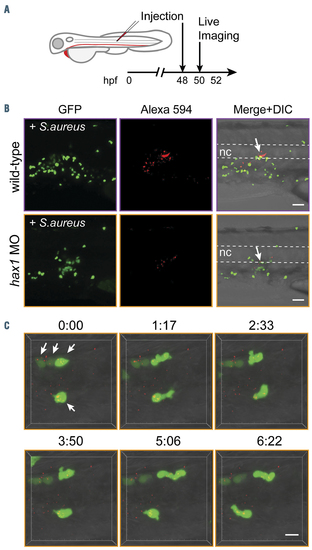
Migration and phagocytosis of neutrophils in the hax1 morphants. (A) Experimental design. (B) Injection of Alexa-594 conjugated Staphylococcus aureus debris into the notochord of tg(mpo:gfp) embryos at 2 days post-fertilization (dpf). Arrows indicate the injected site. Dashed lines indicate the position of the notochord. (C) Still photographs from a time-lapse recording illustrating the migration and phagocytic activity of neutrophils (arrows) in the hax1 morphants. Numbers indicate time in minutes. Scale bars, 40 mm (B) and 10 mm (C). GFP: green fluorescent protein; nc: notochord. PHENOTYPE:
|
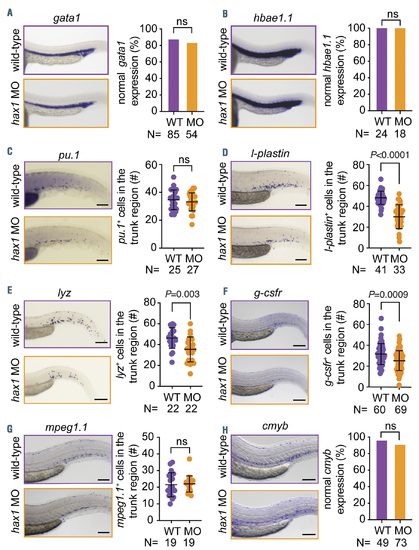
Normal development of erythrocytes, macrophages and hematopoietic stem cells in the hax1 morphants. (A-H) Left panels show representative images of whole mount in situ hybridization for gata1 (A), hbae1.1 (B), pu.1 (C), l-plastin (D), lyz (E), g-csfr (F), mpeg1.1 (G) and cmyb (H) expression in uninjected (WT) and hax1 e1-MO injected embryos at 24 hours post-fertilization (hpf) (A,B) or 48 hpf (C-H). Right panels show quantitative numbers of stained cells in the trunk region. Scale bars indicate 100 mm. Each dot in C-G represents an individual embryo. Data are means } standard deviation. |
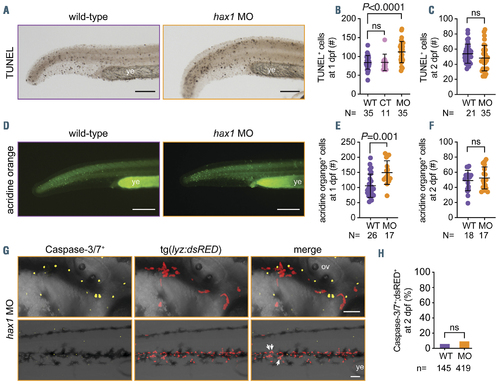
Enhanced apoptosis by hax1 knockdown. (A) Representative images of TUNEL-positive cells in wild-type (WT) and hax1 morphants (MO) at 1 day post-fertilization (dpf). (B, C) Quantitative numbers of TUNEL-positive cells in the trunk region at 1 dpf (B) and 2 dpf (C). Note injection of control (CT) morpholino did not significantly increase the number of TUNEL-positive cells. (D) Representative images of acridine orange-stained cells in WT and hax1 MO at 1 dpf. (E, F) Quantitative numbers of acridine orange-stained cells in the trunk region at 1 dpf (E) and 2 dpf (F). (G) Representative images from the head (top panel) and trunk region (bottom panel) of the tg(lyz:dsRED) embryos injected with hax1 MO showing cells stained with caspase-3/7 reporter (yellow) and neutrophils (red) at 2 dpf. (H) Frequency of caspase-3/7 and dsRED double positive cells in WT and hax1 morphants. n indicates number of dsRED+ cells counted from three wild-type embryos (WT) and 10 morphants (MO) at 2 dpf. Each dot in B, C, E and F represents an individual embryo. Data are means } standard deviation. Scale bars: 100 mm (A, D) and 50 mm (G). ov: otic vesicle; ye: yolk extension. |
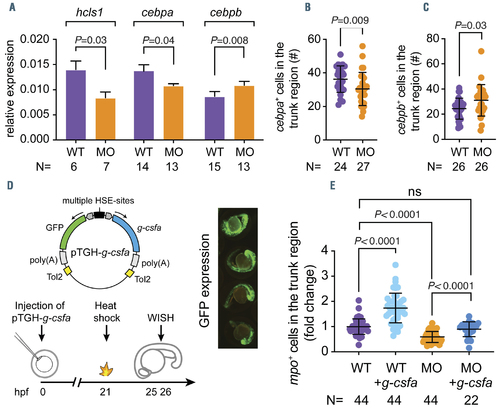
G-csfa induction rescued the reduced neutrophil numbers in the hax1 morphants. (A) Relative expression of hcls1, cebpa, cebpb in wild-type (WT) and morphants (MO) at 2 days post-fertilization (dpf). The b-actin gene was used as an internal control for normalization. N indicates number of biological replicates. (B, C) Quantitative numbers of cebpa- and cebpb-expressing cells in the trunk region of WT and MO at 2 dpf. (D) The top panel illustrates the bi-directional construct (pTGH-g-csfa) used to ectopically induce the zebrafish g-csfa cDNA. Note that green fluorescent protein (GFP) expression was used as a positive control for induction (4 representative embryos are shown in the right panel). The lower panel outlines the timing of the experiment. (E) Fold change of mpo+ cells in the trunk region of embryos at 25 hours post-fertilization (hpf). Each dot represents an individual embryo. N indicates number of embryos. Data are means } standard deviation. |

ZFIN is incorporating published figure images and captions as part of an ongoing project. Figures from some publications have not yet been curated, or are not available for display because of copyright restrictions. |