
Image
|
Figure Caption
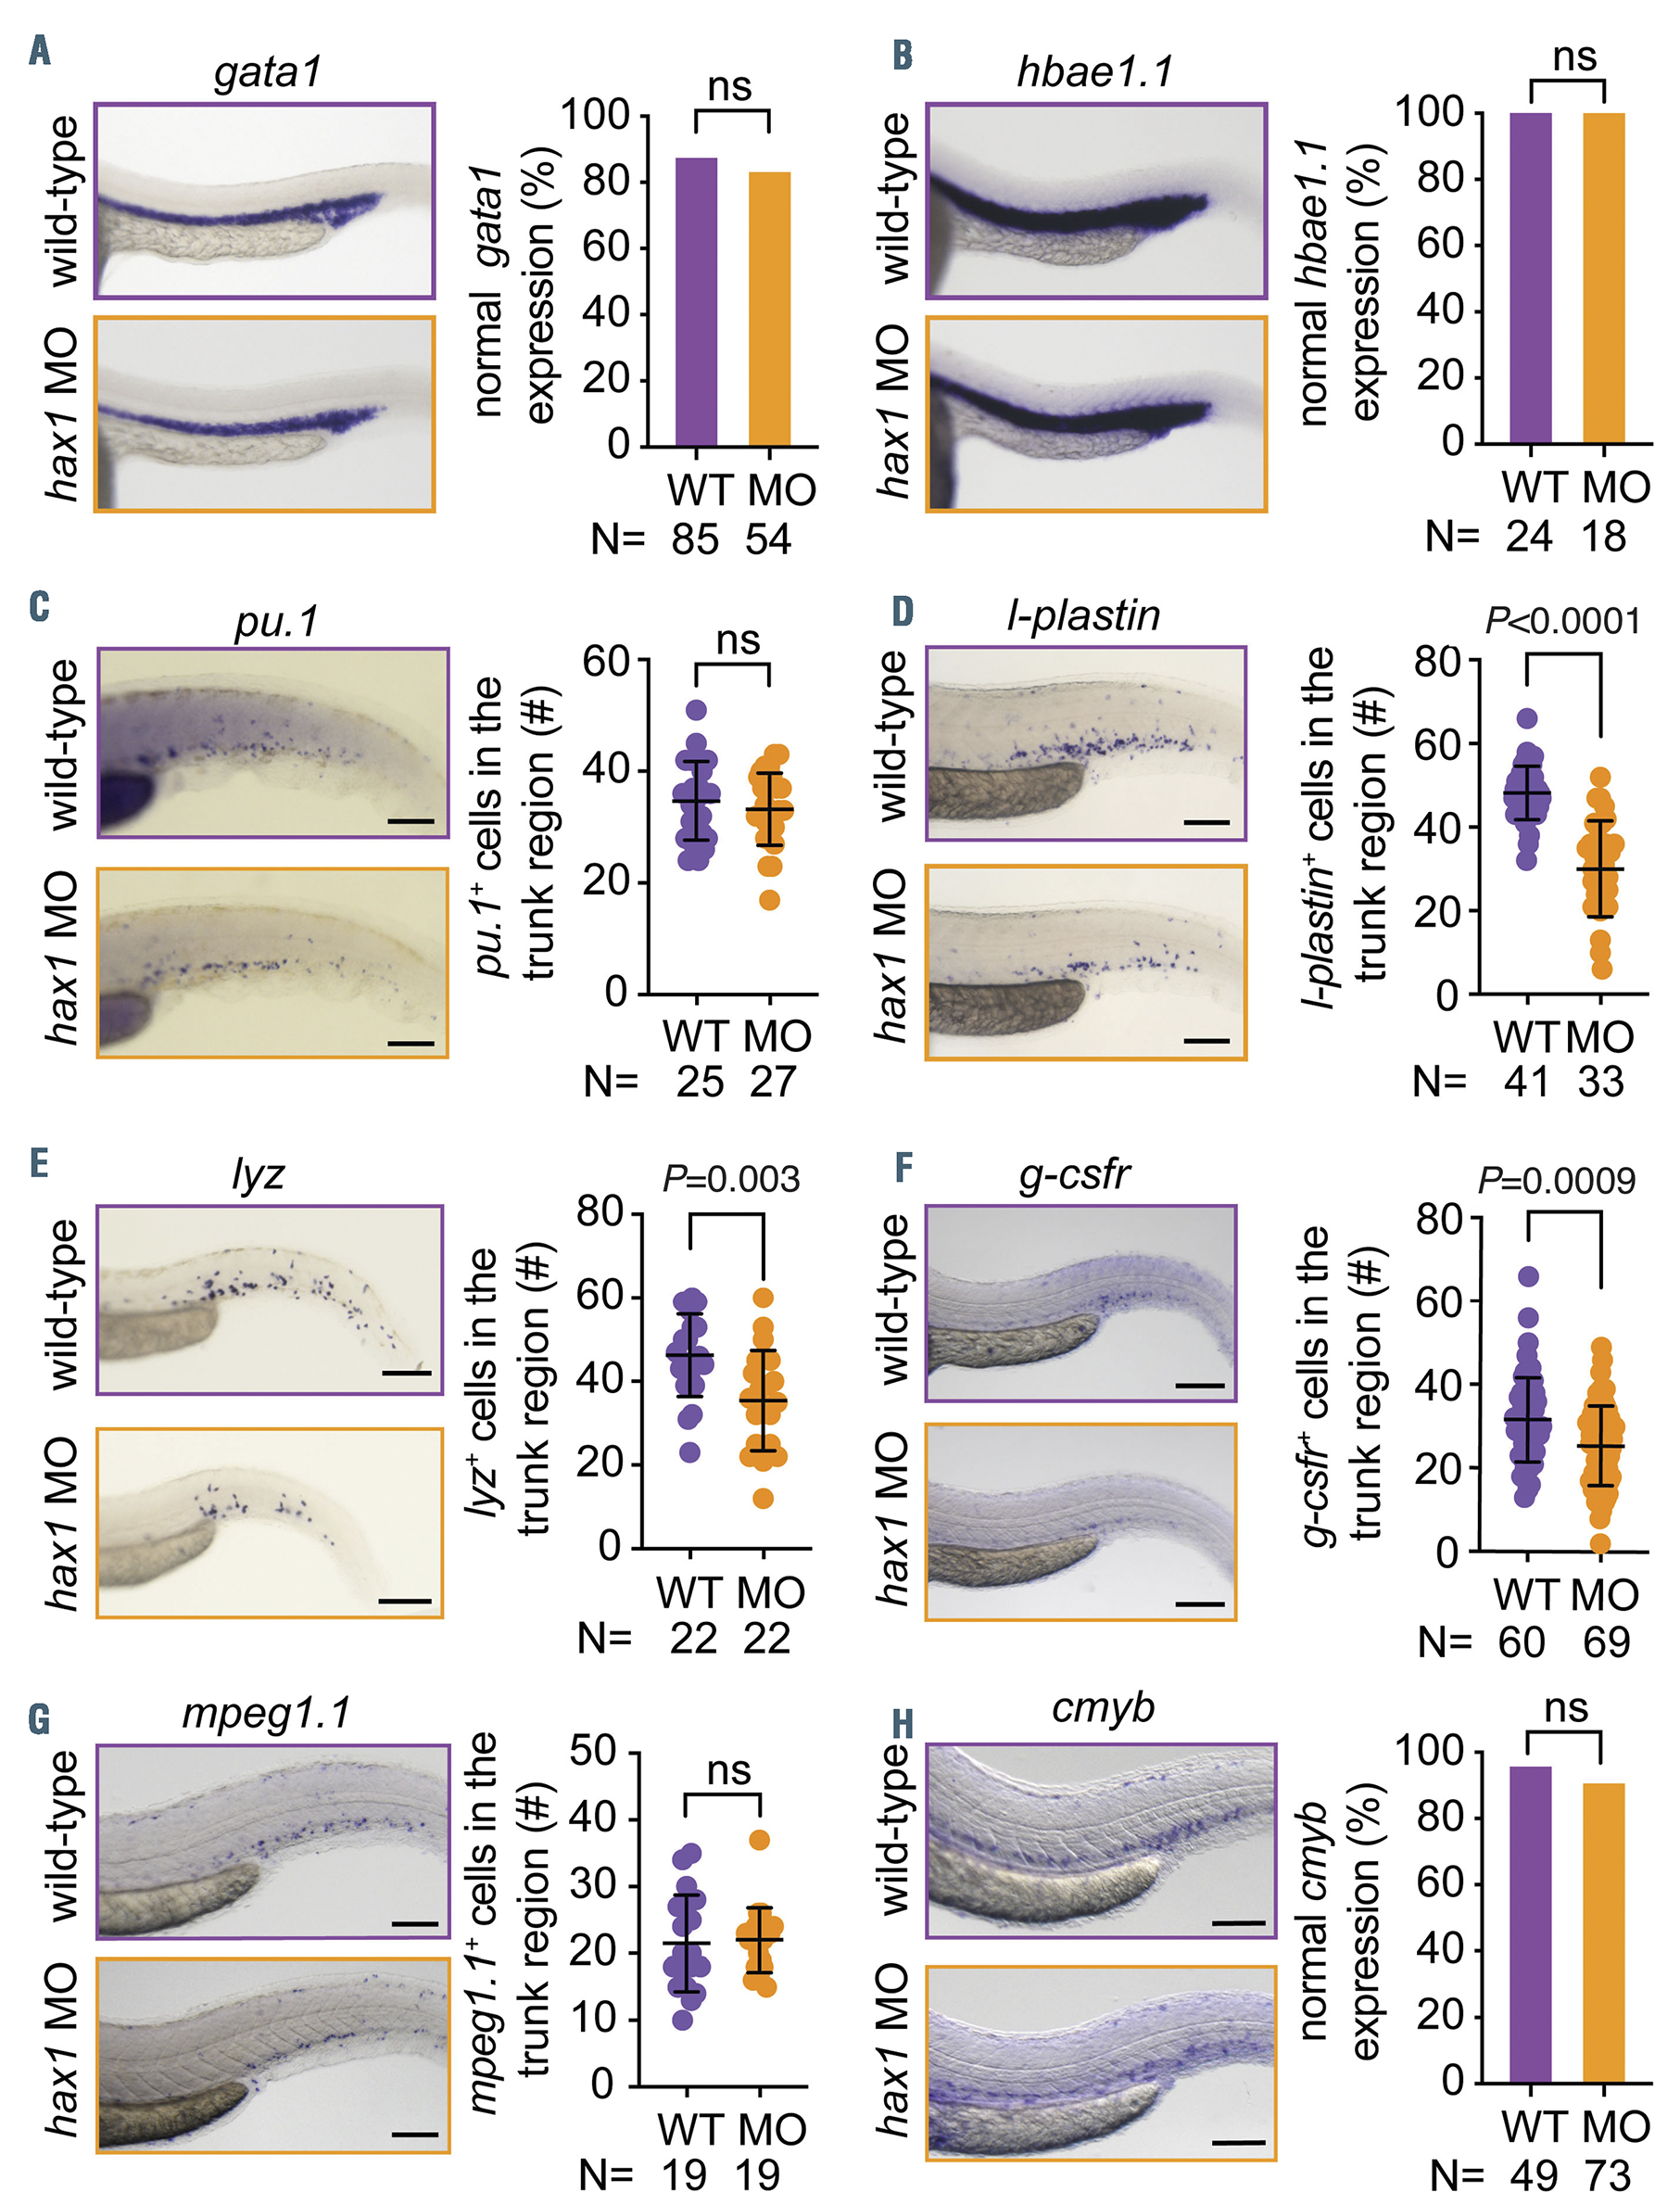
Fig. 4 Normal development of erythrocytes, macrophages and hematopoietic stem cells in the hax1 morphants. (A-H) Left panels show representative images of whole mount in situ hybridization for gata1 (A), hbae1.1 (B), pu.1 (C), l-plastin (D), lyz (E), g-csfr (F), mpeg1.1 (G) and cmyb (H) expression in uninjected (WT) and hax1 e1-MO injected embryos at 24 hours post-fertilization (hpf) (A,B) or 48 hpf (C-H). Right panels show quantitative numbers of stained cells in the trunk region. Scale bars indicate 100 mm. Each dot in C-G represents an individual embryo. Data are means } standard deviation.
Figure Data
Acknowledgments
This image is the copyrighted work of the attributed author or publisher, and
ZFIN has permission only to display this image to its users.
Additional permissions should be obtained from the applicable author or publisher of the image.
Full text @ Haematologica