
|
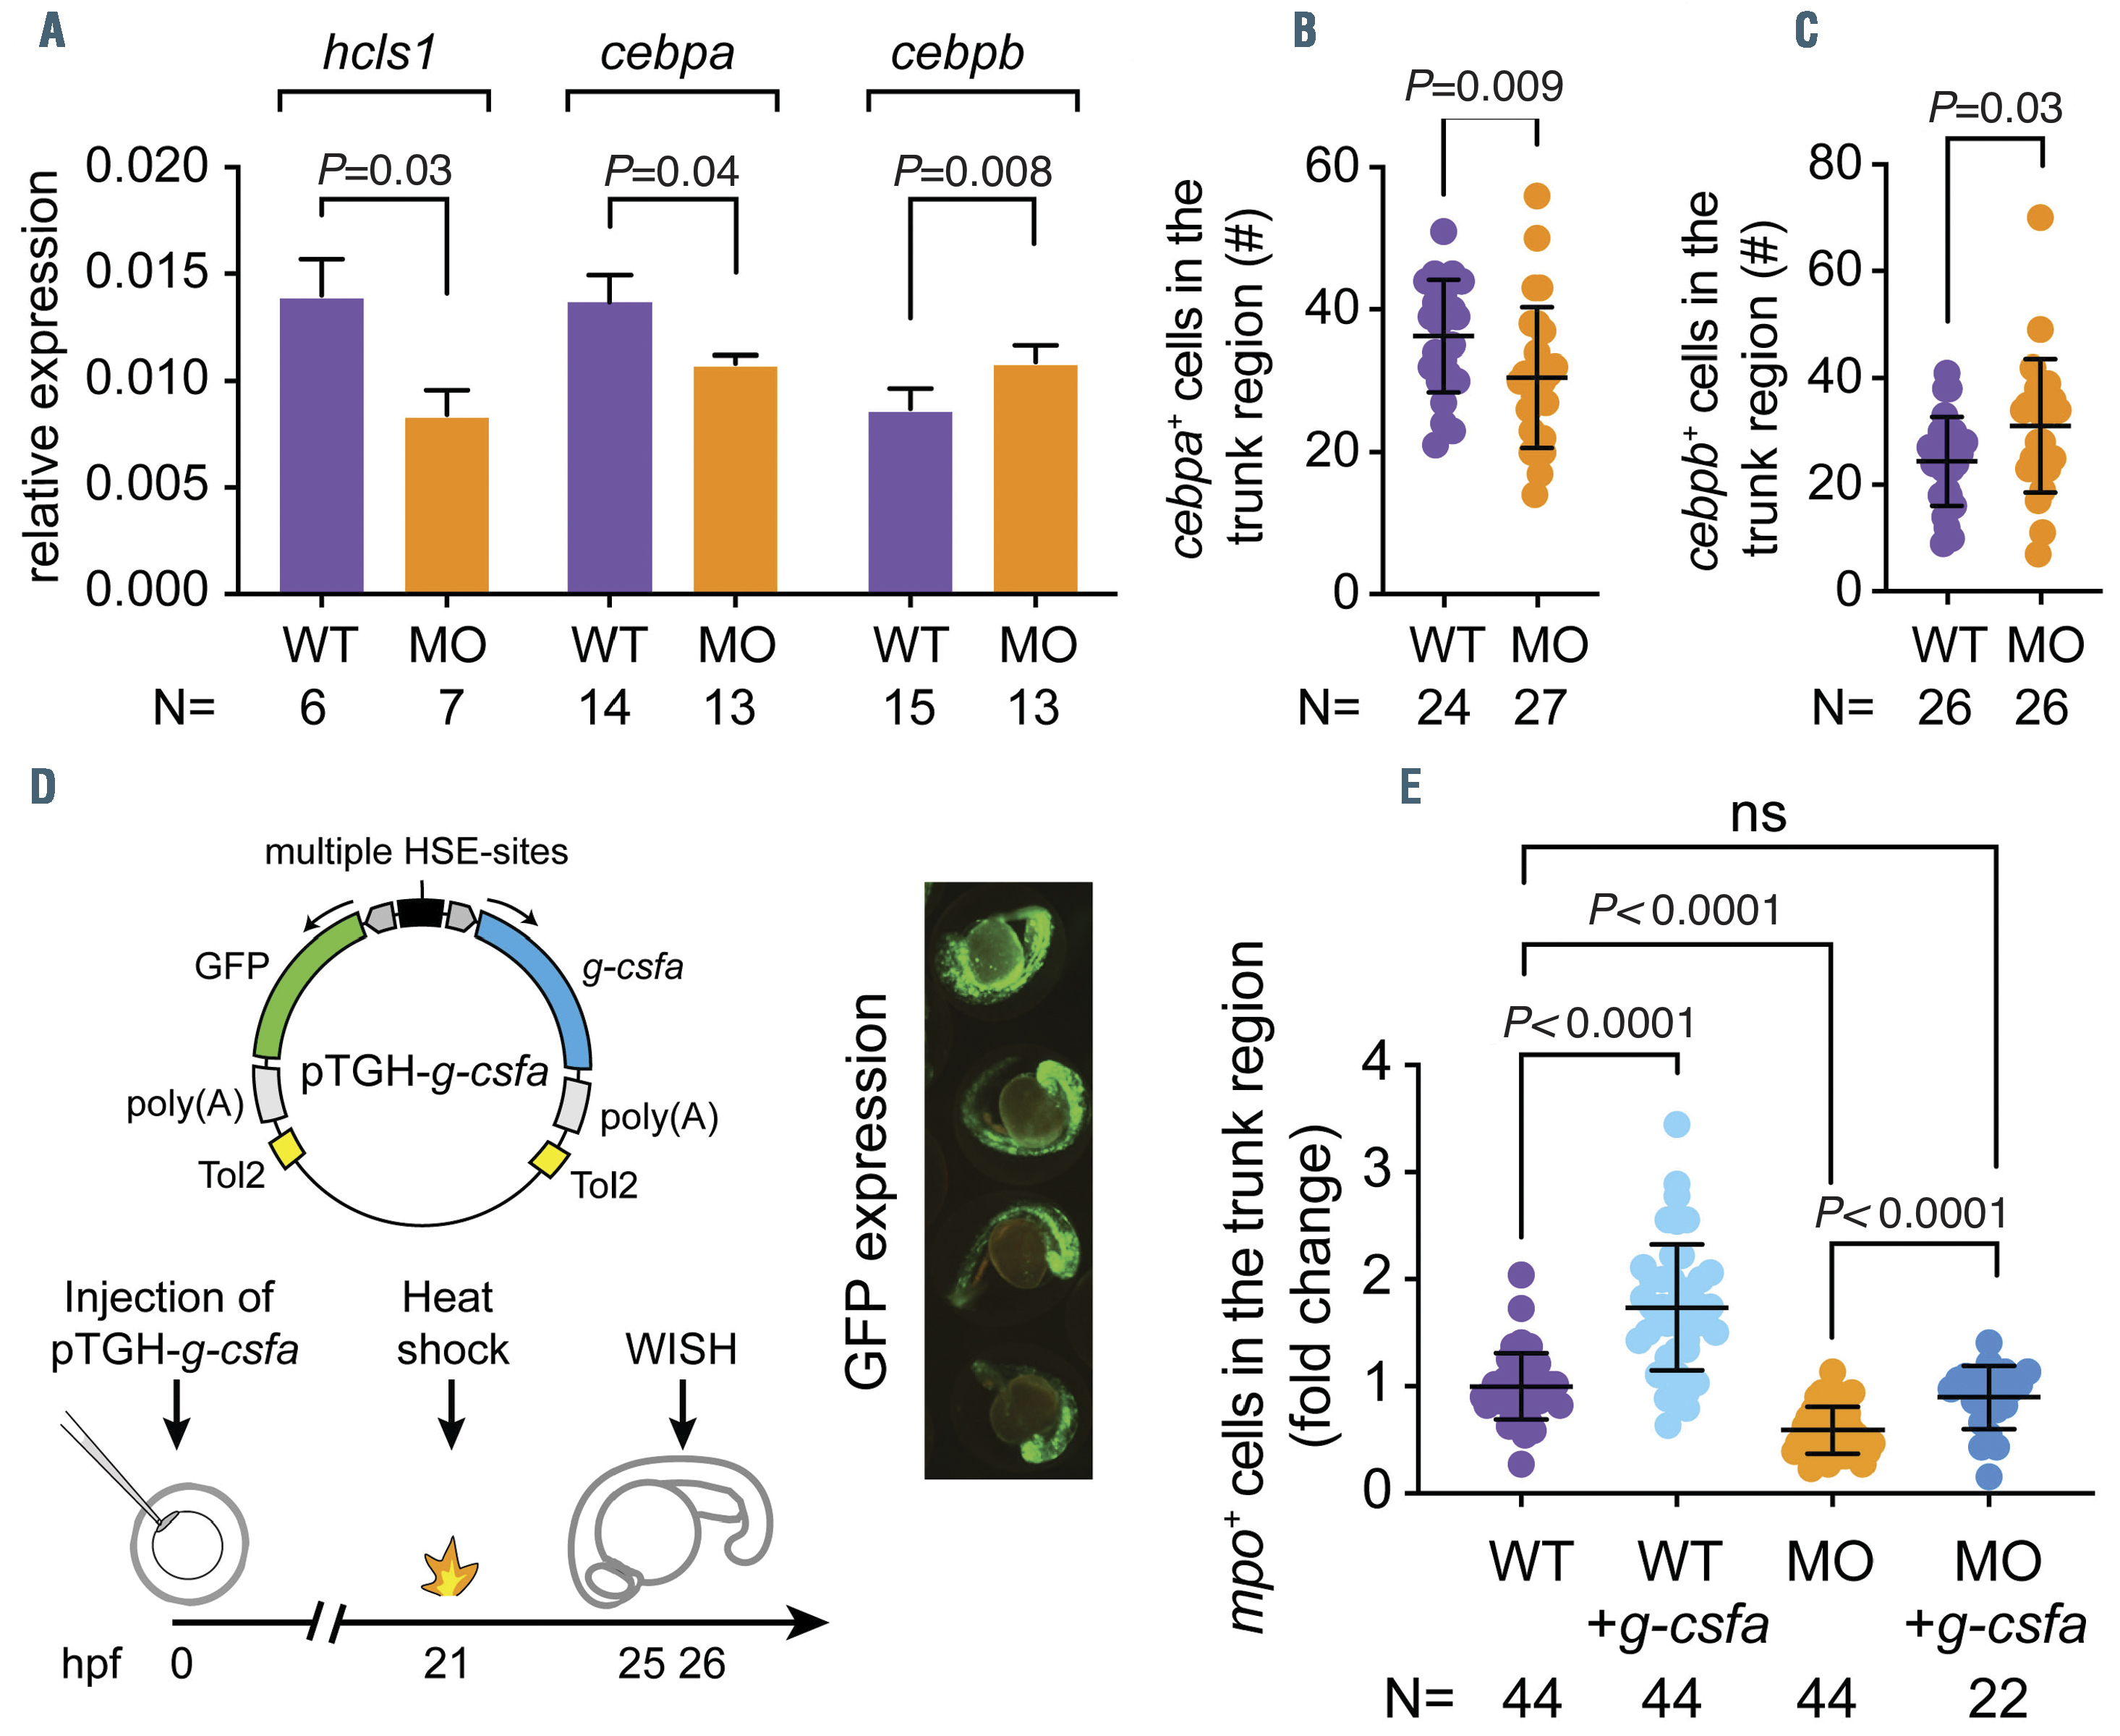
Fig. 6 G-csfa induction rescued the reduced neutrophil numbers in the hax1 morphants. (A) Relative expression of hcls1, cebpa, cebpb in wild-type (WT) and morphants (MO) at 2 days post-fertilization (dpf). The b-actin gene was used as an internal control for normalization. N indicates number of biological replicates. (B, C) Quantitative numbers of cebpa- and cebpb-expressing cells in the trunk region of WT and MO at 2 dpf. (D) The top panel illustrates the bi-directional construct (pTGH-g-csfa) used to ectopically induce the zebrafish g-csfa cDNA. Note that green fluorescent protein (GFP) expression was used as a positive control for induction (4 representative embryos are shown in the right panel). The lower panel outlines the timing of the experiment. (E) Fold change of mpo+ cells in the trunk region of embryos at 25 hours post-fertilization (hpf). Each dot represents an individual embryo. N indicates number of embryos. Data are means } standard deviation.