FIGURE SUMMARY
Title

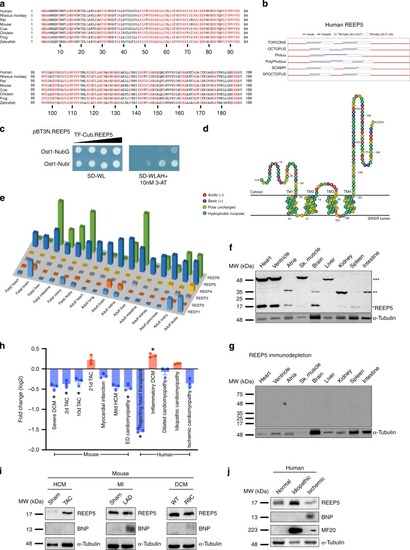
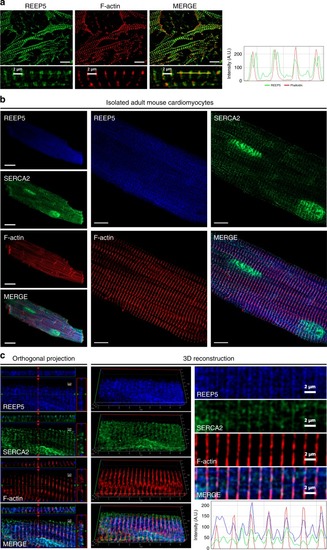
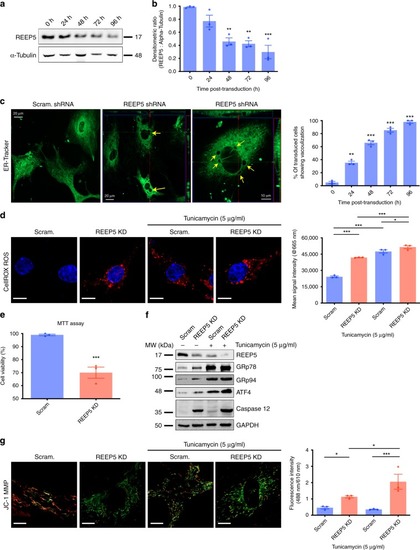
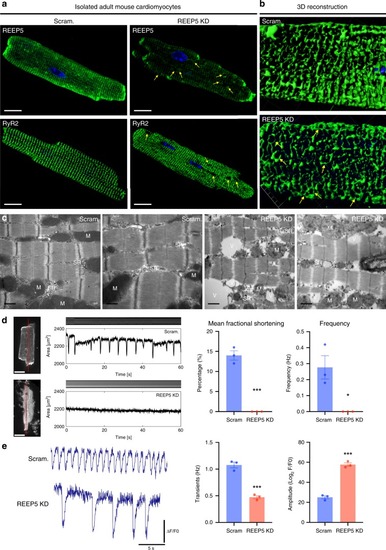
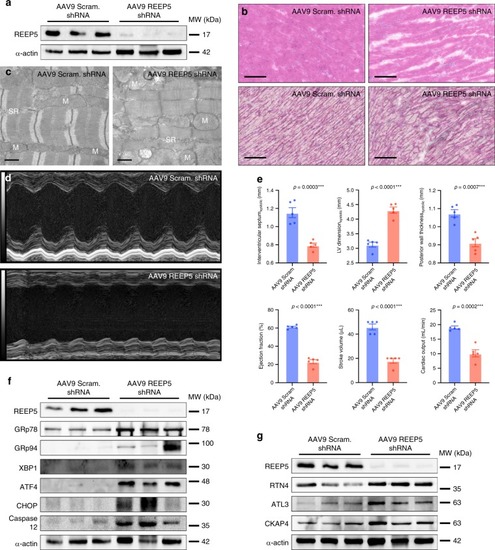
REEP5 depletion causes sarco-endoplasmic reticulum vacuolization and cardiac functional defects

Authors
Lee, S.H., Hadipour-Lakmehsari, S., Murthy, H.R., Gibb, N., Miyake, T., Teng, A.C.T., Cosme, J., Yu, J.C., Moon, M., Lim, S., Wong, V., Liu, P., Billia, F., Fernandez-Gonzalez, R., Stagljar, I., Sharma, P., Kislinger, T., Scott, I.C., Gramolini, A.O.
Source
Full text @ Nat. Commun.

REEP5 is an evolutionarily conserved, muscle-enriched membrane protein.

a A multispecies alignment of REEP5 from vertebrates. b Prediction of human REEP5 protein topography generated by TOPCONS. c Membrane yeast two-hybrid assay of REEP5 membrane topology. SD-WL is yeast media that lacks tryptophan and leucine and selects for cells that contain both bait and prey plasmids. SD-WLAH +10 nM 3-AT is yeast media that lacks tryptophan, leucine, adenine, and histidine and selects for cells in which bait and prey are interacting. d Predicted membrane topology model of human REEP5 generated by modification of a T(E)Xtopo output in Protter (http://wlab.ethz.ch/protter). e REEP5 mRNA transcript levels obtained from Human Protein Atlas across various mouse tissues. f Immunoblot of REEP5 protein expression in mouse tissues. Asterisks to the right indicate the number of predicted REEP5 oligomers detected based on anticipated molecular weight. g Immunodepletion of REEP5 antigens with bacterially expressed 6xHis-REEP5. h GEO RNA-seq datasets demonstrate changes in REEP5 expression across various mouse and human cardiovascular diseases; * indicates a statistically significant p < 0.05 in a Tukey’s multiple comparison analysis. Data are presented as mean ± SEM with n = 3 biologically independent measurements. i Immunoblot analysis of REEP5 and BNP expression from cardiac tissue of hypertrophic cardiomyopathy (HCM), myocardial infarction (MI), and dilated cardiomyopathy (DCM) mouse models. j Immunoblot analysis of REEP5, BNP, and MHC expression from human cardiac samples of normal, idiopathic, and ischemic cardiomyopathy. Source data containing original uncropped immunoblots are provided as a Source Data file.

REEP5 expression shows consistent SR staining pattern in cardiac myocytes.

a Immunofluorescence analysis of endogenous REEP5 expression (green) and phalloidin-rhodamine staining (red) in CMNCs. Right panel, line-scan analysis (from yellow line) demonstrates SR expression pattern in CMNCs. Scale, 10 μm. b Immunofluorescence of isolated adult mouse cardiac myocytes with REEP5 (blue) co-stained with SERCA2 (green) and phalloidin-rhodamine (red). Scale, 20 μm (left panel), 10 μm (right panel). c Orthogonal projection, three-dimensional reconstructive and line-scan analyses demonstrates co-localization between REEP5, SERCA2, and phalloidin signal. (Left panel): the top panels represent cell imaging in the xz plane, while side panels represent cell imaging in the yz plane. All images shown are representative of approximately 40–50 total images captured per condition, n = 3 independent biological replicates.

In vitro REEP5 depletion in cardiac myocytes results in SR/ER membrane destabilization and dysfunction.

a Immunoblotting analysis of lentiviral-mediated REEP5 depletion in CMNCs at 0, 24, 48, 72, 96 h post transduction. b Quantitative analysis of REEP5 expression levels showed 60% reduction 48 h after REEP5 shRNA transduction. Quantification was done under ×40 objective lens and approximately 40–50 cells were scored for each experimental condition, n = 3 independent biological replicates; data are presented as mean ± SEM. c Confocal imaging of CMNCs stained with ER-tracker showed SR/ER vacuoles (yellow arrows) 48 h post viral transduction. Vacuoles were observed starting 24 h post transduction, peaking after 96 h post lentiviral infection with REEP5 shRNA. Quantification was done under ×40 objective lens and approximately 30–40 cells were scored for each experimental condition, n = 3 independent biological replicates; data are presented as mean ± SEM. d Confocal imaging of CMNCs stained with CellROX oxidative stress dye 48 h post viral transduction with REEP5 shRNA. Scale, 10 μm. Spectrophotometric analysis showed a marked increase in ROS levels following shRNA-mediated REEP5 depletion in the presence and absence of tunicamycin, n = 40–50 cells examined under ×40 objective, n = 3 independent biological replicates; data are presented as mean ± SEM. e Cardiac myocyte cell viability levels 48 h post viral transduction with REEP5 shRNA measured by MTT assay, n = 3 independent biological replicates; data are presented as mean ± SEM. f Immunoblotting analysis of REEP5, ER stress markers (GRp78, GRp94, and ATF4), and ER-dependent apoptosis marker (caspase 12) expression levels upon REEP5 depletion in the presence or absence of tunicamycin. g Confocal imaging of CMNCs stained with mitochondrial membrane potential dye JC-1 48 h post viral transduction with REEP5 shRNA. Scale, 10 μm, n = 40–50 cells examined under ×40 objective lens over 3 independent experiments. Asterisks indicate a statistically significant p value in a Tukey’s multiple comparison analysis where *p < 0.05, **p < 0.01, and ***p < 0.001; data are presented as mean ± SEM. Source data containing original uncropped immunoblots are provided as a Source Data file. All images shown are representative of approximately 30–40 total images captured per condition.

In vitro REEP5 depletion leads to SR vacuolization and sarcomeric dysfunction in adult mouse cardiac myocytes.

a Immunofluorescence of adult mouse cardiac myocytes stained with REEP5 and RyR2 48 h post viral transduction with REEP5 shRNA. Scale, 20 μm. b Three-dimensional reconstruction analysis of RyR2 staining of the SR in Scram and REEP5-depleted myocytes. c Transmission electron microscopy in REEP5-depleted adult mouse cardiac myocytes revealed SR vacuoles and disrupted SR membranes compared to scram controls. M mitochondria, SR sarcoplasmic reticulum, TT T-tubule, V vacuoles. Scale, 0.5 nm. d Optical measurements of spontaneous myocyte contractility in scram and REEP5-depleted adult mouse cardiac myocytes revealed a significant decrease in both fractional shortening measurements and frequency in REEP5-depleted myocytes. Left: still images of representative cardiac myocytes. Scale, 20 μm. Red line indicates region of image used to generate kymographs shown above contractile pulses tracings. n = 30 cells examined over three independent experiments; data are presented as mean ± SEM. e Ca2+ imaging of myocytes showing the frequency of Ca2+ waves and Ca2+ transients amplitude 48 h post viral transduction with REEP5 shRNA, n = 40–50 cells examined per condition over 3 independent experiments. Asterisks indicate a statistically significant p value in a Tukey’s multiple comparison analysis where *p < 0.05 and ***p < 0.001; data are presented as mean ± SEM. All images shown are representative of approximately 30–40 total images captured per condition.

The C-terminal cytosolic domain of REEP5 is required for stabilizing SR/ER morphology.

a Schematic diagrams of REEP5 constructs used for REEP5 dimerization study shown in Fig. 5b–d. b Immunoblot analysis of endogenous REEP5 monomer (~17 kDa) and REEP5 dimer (~34 kDa), and exogenous REEP5 monomer (~22 kDa) and exogenous REEP5 dimer (~44 kDa) in HEK293 transfected with REEP5-V5-6xHis construct. c Immunoblots of REEP5 dimer dissociation in response to increasing DTT concentration. Diamonds to the left indicate the detection of endogenous (orange) and exogenous (blue) REEP5 monomers and dimers. d Co-immunoprecipitation assays in HEK293 cells. REEP5-V5 and CnVA-REEP5 were transfected into cells and precipitated with V5 or flag antibody. Left, control immunoblot experiments. Right panel, CnVA-REEP5 was immunoprecipitated via anti-V5 antibody in REEP5-V5-6xHis transfected HEK293 cells. e Immunoblot analysis of C2C12 cells transfected with REEP5 truncation mutants shows depletion of REEP5 dimers in the absence of the carboxyl terminal domain. f Confocal imaging analysis of EYFP (green) and DAPI (blue) staining shows truncation of the carboxyl terminal domain of REEP5 (Δ114–189) causes ER luminal vacuolization in transfected C2C12 myoblasts. Scale, 10 μm. Right, image intensity analysis along axis. g Schematic diagram of truncated REEP5 mutant constructs fused with GFP. Amino acid sequences are shown. h Live-cell confocal imaging of C2C12 myoblasts expressing the carboxyl-terminus truncated mutant of REEP5 (Δ114–189) and recombinant mCherry-fused mitochondrial targeting signal (mCherry-mito) or luminal ER marker (mCherry-KDEL). Scale, 10 μm. i Live-cell confocal imaging of C2C12 myoblasts expressing four truncated REEP5 mutants co-expressed with mCherry-KDEL suggests the importance of the C-terminal cytosolic domain of REEP5 in stabilizing ER membrane curvatures. Scale, 10 μm. Source data containing original uncropped immunoblots are provided as a Source Data file. All images shown are representative of approximately 40–50 total images captured per condition, n = 3 independent biological replicates.

Mass spectrometry analysis identifies REEP5 interactions with known cardiac SR shaping proteins.

a Immunoblot analysis of nickel-His purification of CnVA-REEP5 from transfected HEK293 cells shows stable expression of CnVA-REEP5 and successful immunoprecipitation of CnVA-REEP5 monomer (~34 kDa) and dimer (~68 kDa). b Identification of known SR/ER-shaping proteins as REEP5 interacting proteins by mass spectrometry analysis. Average precursor MS1 peak areas (peptide m/z signal) as defined by iBAQ (intensity based absolute quantification) are shown, n = 3 independent mass spectrometry runs. To calculate fold change, average null values (n.d.—not detected) were inputted with a value of 10. RTN reticulon, ATL atlastin, CKAP4 cytoskeleton-associated protein 4, ACTC1 alpha cardiac muscle actin 1, MYL6 myosin light chain 6, GAPDH glyceraldehyde-3-phosphate dehydrogenase. Asterisks indicate a statistically significant p value in a Tukey’s multiple comparison analysis where *p < 0.05. c RNASeq analysis of the RTN, ATL families of proteins, and CKAP4 in human fetal heart and adult heart tissue data using data from Human Protein Atlas. d Immunoblot analysis of nickel-His REEP5 immunoprecipitation lysates for RTN4/Nogo-A/B, ATL3, and CKAP4, n = 3. e HEK293 cells were transfected with myc-tagged Nogo-A and Nogo-B plasmids and detected with myc and α-tubulin antibodies. f Co-immunoprecipitation assay of cotransfected HEK293 cells with anti-REEP5 antibody (left panel) and anti-RTN4/Nogo-A/B antibody (right panel) demonstrated interaction between REEP5 and RTN4, n = 3. Eluates were collected on ice and loaded directly for blotting, or samples were boiled prior to blotting. gj Co-immunoprecipitation and reverse order co-immunoprecipitation assays with g anti-REEP5, h anti-RTN4/Nogo-A/B, i anti-ATL3, and j anti-CKAP4 antibodies in adult mouse cardiac microsomes (input), followed by immunoblots analysis, n = 5. Source data containing original uncropped immunoblots are provided as a Source Data file.

In vivo CRISPR/Cas9-mediated REEP5 depletion in zebrafish embryos leads to cardiac abnormalities.

a Immunofluorescence analysis of REEP5 expression in wild-type zebrafish hearts at 48 and 96 hpf. Co-staining for REEP5 (green), zn-8 (general plasma membrane; red) and DAPI (nuclear; blue) revealed REEP5 expression in both ventricular and atrial cardiac myocytes, with no nuclear or membrane localization evident. Scale, 50 μm. be CRISPR/Cas9-mediated depletion of REEP5 with varying gRNA concentrations reveals the contribution of REEP5 to embryonic heart development in zebrafish embryos. Images shown are representative of 331 control, 410 2× REEP5 gRNA, and 296 3× REEP5 gRNA total injected embryos, n = 3 independent biological replicates. Scale, 500 μm. f, g Optical imaging analysis of control and 2× REEP5 gRNA injected embryos shows cardiac looping defects associated with REEP5-targeted gRNA injection. Scale, 10 μm. h Movie analysis of REEP5 gRNA injected embryos shows dyssynchronous atrio-ventricular beating rhythms compared to control zebrafish embryos. Area profiles were smoothened with a Gaussian curve with σ = 0.2 s. ik Bar graphs showing i phenotypic penetrance represented as percentage, j heart rate represented as beats per minute (bmp), and k atrioventricular beating dyssynchrony represented as percentage from 331 control, 410 2× REEP5 gRNA, and 296 3× REEP5 gRNA total injected embryos, n = 3 independent biological replicates. Asterisks indicate a statistically significant p value in a Tukey’s multiple comparison analysis where *p < 0.05, **p < 0.01, and ***p < 0.001; data are presented as mean ± SEM.

Genetic compensation in <italic>reep5</italic> CRISPR knockout zebrafish mutant.

a Sequencing analysis generated by Sanger Synthego shows reep5 gRNA targeted and edited homozygous CRISPR mutant sequences in the region around the guide sequence. The horizontal black underlined region represents the guide sequence and the horizontal red underline indicates the protospacer adjacent motif (PAM) site with the vertical black line representing the cut site. b, c CRISPR/Cas9-mediated reep5 homozygous mutant compared to control zebrafish embryos, n = 3 independent biological crosses. Scale, 500 μm. d, e Optical imaging analysis of control and reep5 CRISPR mutant embryos shows normal cardiac chamber orientation and development in the reep5 CRISPR mutant hearts. Scale, 10 μm. f Heart rate analysis of control and reep5 homozygous mutant embryos upon 600 μM verapamil treatment for 30 min; a total of 46 control, 24 reep5 CRISPR mutants, 32 control + verapamil, and 36 reep5 CRISPR mutants + verapamil embryos were analyzed, n = 3 independent biological crosses; data are presented as mean ± SEM. g, hreep5 CRISPR mutants injected with REEP5 MO (1 ng) appears phenotypically normal compared to overt cardiac abnormalities in the REEP5 morphant embryos. Images shown are representative of 287 REEP5 MO and 232 reep5 CRISPR mutants injected with REEP5 MO embryos, n = 3 independent biological crosses. Scale, 500 μm. i, j Optical imaging analysis of REEP5 MO and reep5 CRISPR mutants injected with REEP5 MO embryo hearts shows normal cardiac chamber orientation and development in the reep5 CRISPR mutant hearts. Scale, 10 μm. k Bar graph showing phenotypic penetrance represented as percentage from 287 REEP5 MO and 232 reep5 CRISPR mutants injected with REEP5 MO embryos, n = 3 independent biological crosses; data are presented as mean ± SEM. l Immunoblot analysis of cardiac-enriched ER structure proteins (RTN4, ATL3, and CKAP4) in reep5 CRISPR homozygous mutants shows upregulation of RTN4 in reep5 CRISPR mutant hearts. Source data containing original uncropped immunoblots are provided as a Source Data file. Asterisks indicate a statistically significant p value in a Tukey’s multiple comparison analysis where **p < 0.01 and ***p < 0.001.

In vivo AAV9-mediated REEP5 depletion in mice results in increased cardiac fibrosis, activated cardiac ER stress, cardiac dysfunction, and death.

a Immunoblot analysis of AAV9-mediated REEP5 depletion in mice 4 weeks post viral infection. b Histological analyses of AAV9 Scram shRNA and REEP5 shRNA injected mouse hearts at 4 weeks post viral infection. Top panels: H&E, bottom panels: Masson’s trichrome stain. Scale, 20 μm. All images shown are representative of approximately 20 total images captured per condition, n = 3 independent biological replicates. c Transmission electron microscopy analysis of AAV9 REEP5 shRNA-injected myocardium reveals degeneration of muscle fibers and disrupted SR membranes and organization compared to scram controls. M mitochondria, SR sarcoplasmic reticulum, V vacuoles. Scale, 0.5 nm. All images shown are representative of approximately 20 total images captured per condition, n = 3 independent biological replicates. d In vivo echocardiographic heart function assessment of AAV9 scram and AAV9 REEP5 shRNA-injected mice at 4 weeks post viral infection, n = 5. e Echocardiographic M-mode and B-mode measurements showed significantly compromised cardiac function with reduced cardiac ejection fraction and cardiac output, n = 5 independent biological replicates. Asterisks indicate a statistically significant p value in a Tukey’s multiple comparison analysis where ***p < 0.001; data are presented as mean ± SEM. f Immunoblotting analysis of cardiac ER stress markers (GRp78, GRp94, XBP1, ATF4, and CHOP) and ER-dependent apoptosis (caspase 12) upon AAV9-induced REEP5 depletion in vivo in mice, n = 3; p values are shown. g Immunoblots of RTN4, ATL3, and CKAP4 upon AAV9-induced REEP5 depletion in vivo in mice, n = 3 independent biological replicates. Source data containing original uncropped immunoblots are provided as a Source Data file.

ZFIN is incorporating published figure images and captions as part of an ongoing project. Figures from some publications have not yet been curated, or are not available for display because of copyright restrictions.

Unillustrated author statements

PHENOTYPE:
Fish:
Knockdown Reagent:
Observed In:
Stage: Days 7-13
Acknowledgments
This image is the copyrighted work of the attributed author or publisher, and ZFIN has permission only to display this image to its users. Additional permissions should be obtained from the applicable author or publisher of the image. Full text @ Nat. Commun.