|
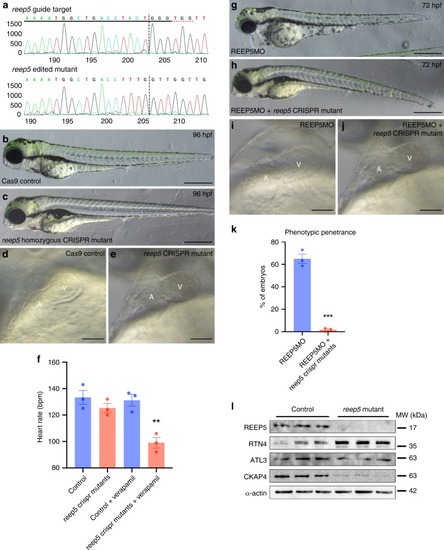
Genetic compensation in <italic>reep5</italic> CRISPR knockout zebrafish mutant.a Sequencing analysis generated by Sanger Synthego shows reep5 gRNA targeted and edited homozygous CRISPR mutant sequences in the region around the guide sequence. The horizontal black underlined region represents the guide sequence and the horizontal red underline indicates the protospacer adjacent motif (PAM) site with the vertical black line representing the cut site. b, c CRISPR/Cas9-mediated reep5 homozygous mutant compared to control zebrafish embryos, n = 3 independent biological crosses. Scale, 500 μm. d, e Optical imaging analysis of control and reep5 CRISPR mutant embryos shows normal cardiac chamber orientation and development in the reep5 CRISPR mutant hearts. Scale, 10 μm. f Heart rate analysis of control and reep5 homozygous mutant embryos upon 600 μM verapamil treatment for 30 min; a total of 46 control, 24 reep5 CRISPR mutants, 32 control + verapamil, and 36 reep5 CRISPR mutants + verapamil embryos were analyzed, n = 3 independent biological crosses; data are presented as mean ± SEM. g, hreep5 CRISPR mutants injected with REEP5 MO (1 ng) appears phenotypically normal compared to overt cardiac abnormalities in the REEP5 morphant embryos. Images shown are representative of 287 REEP5 MO and 232 reep5 CRISPR mutants injected with REEP5 MO embryos, n = 3 independent biological crosses. Scale, 500 μm. i, j Optical imaging analysis of REEP5 MO and reep5 CRISPR mutants injected with REEP5 MO embryo hearts shows normal cardiac chamber orientation and development in the reep5 CRISPR mutant hearts. Scale, 10 μm. k Bar graph showing phenotypic penetrance represented as percentage from 287 REEP5 MO and 232 reep5 CRISPR mutants injected with REEP5 MO embryos, n = 3 independent biological crosses; data are presented as mean ± SEM. l Immunoblot analysis of cardiac-enriched ER structure proteins (RTN4, ATL3, and CKAP4) in reep5 CRISPR homozygous mutants shows upregulation of RTN4 in reep5 CRISPR mutant hearts. Source data containing original uncropped immunoblots are provided as a Source Data file. Asterisks indicate a statistically significant p value in a Tukey’s multiple comparison analysis where **p < 0.01 and ***p < 0.001.
|